EFDC+ Explorer
A Pre- & Post-Processor for the Environmental Fluid Dynamics Code
Spatial Analysis
EE provides powerful 2D and 3D visualization capabilities for model pre- and post-processing, covering water column constituents, sediment bed properties, and boundary conditions. Zooming and panning tools allow display at any spatial scale and perspective, while multiple sub-options within each view help users understand and communicate model behavior relative to real-world physical conditions — supporting informed decision-making by engineers, scientists, and regulators.
3D Visualization
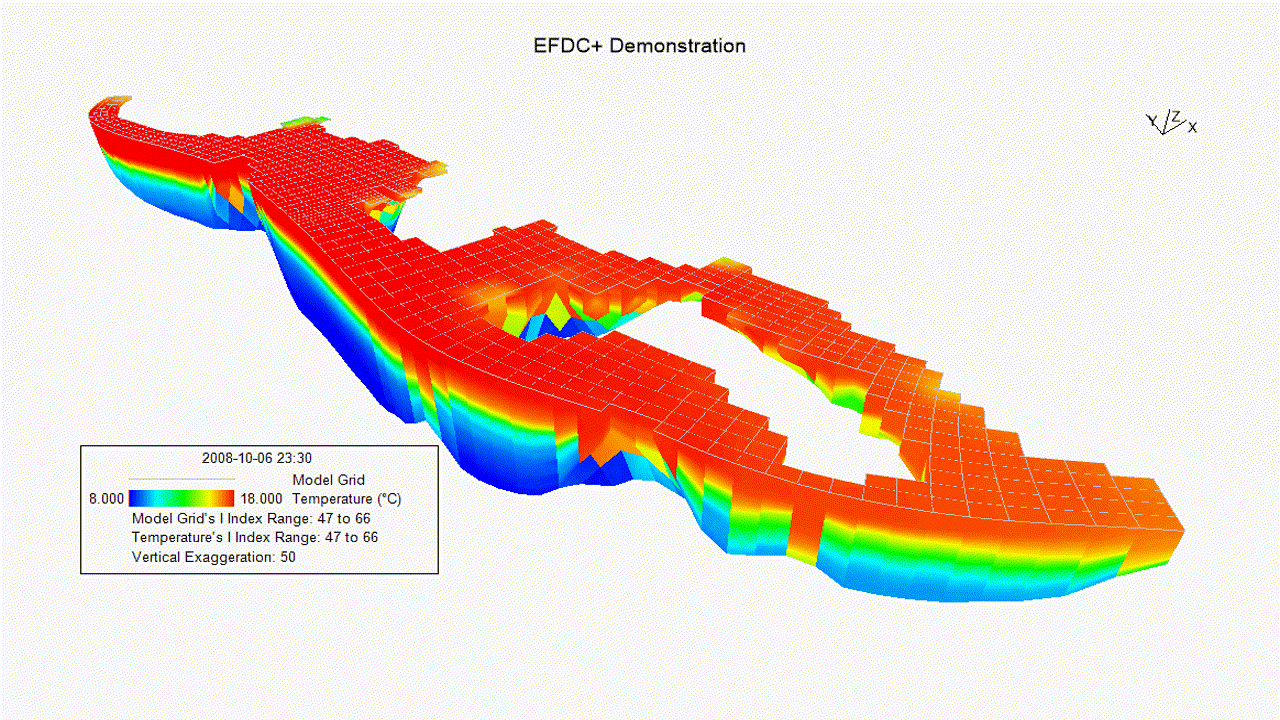
3D slice through Lake Washington showing temperature.
3D Visualization
EE’s 3D visualization features include planar slices through the X, Y, or Z axis, parameter-based blanking, fly-through animations, and more.
Horizontal Slicing
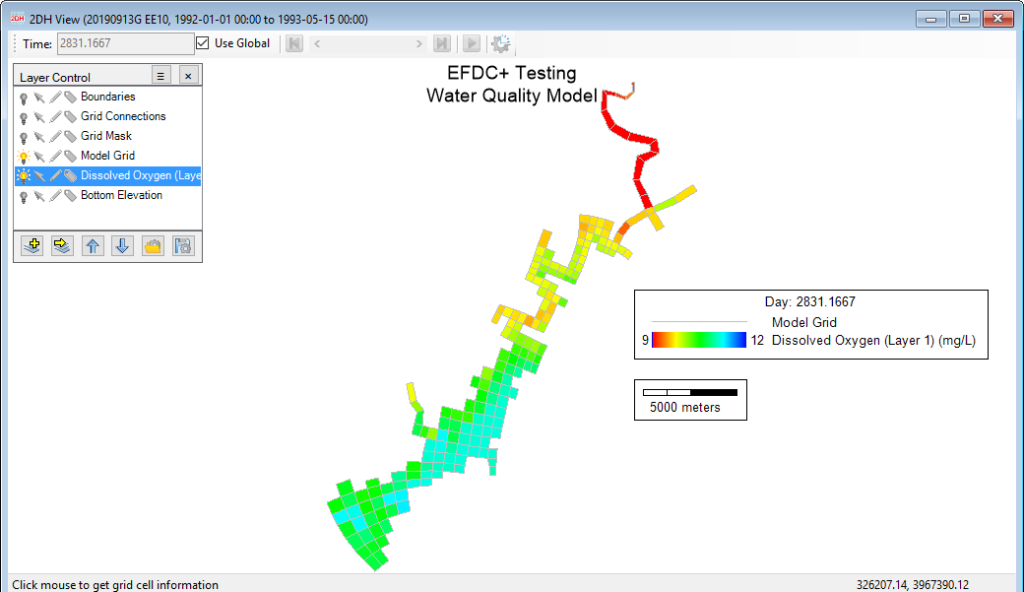
A horizontal slice of dissolved oxygen through the model.
Horizontal Slicing
In the 2D map view, results can be displayed by vertical layer or at a specific depth or elevation. Layer views support both depth-averaged values and individual vertical layer display. The figure shows an example of dissolved oxygen concentration in the bottom model layer.
Vertical Profiles
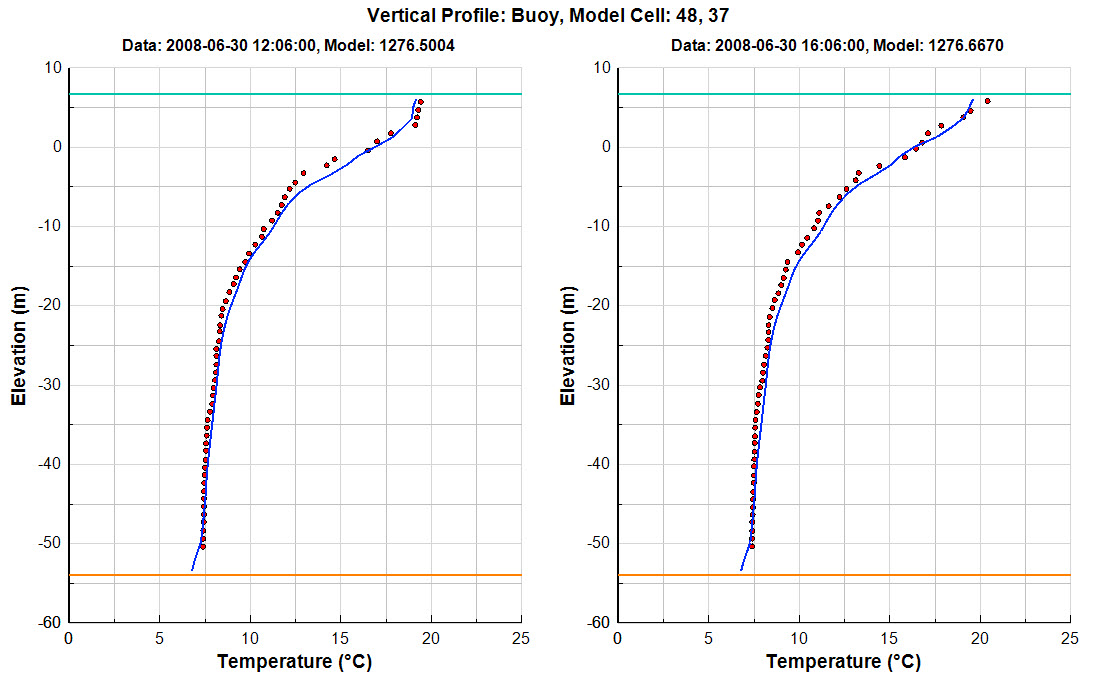
Vertical profiles of temperature.
Vertical Profiles
Vertical profile plots are essential for calibration and analysis in stratified water bodies. EE enables rapid generation of these plots, with multiple monitoring locations displayed on the same figure for easy comparison.
Vertical Slicing
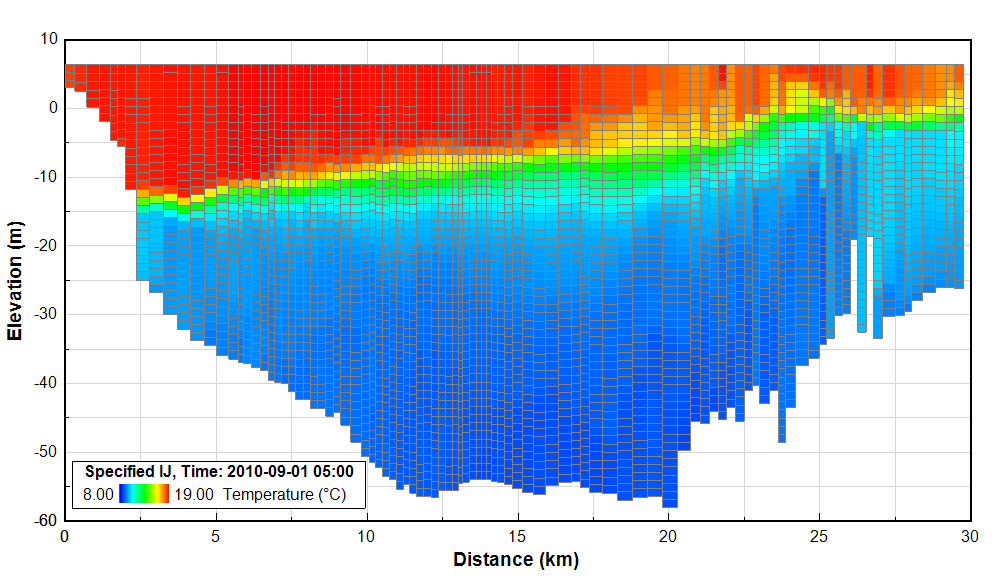
A vertical slice of temperature cut through the Lake Washington model domain.
Vertical Slicing
EE supports cross-sectional cuts through the model domain for most parameters — including velocity, sediment transport, and dissolved oxygen. Slices can be oriented along any I or J grid axis or follow a user-defined path, enabling detailed spatial and temporal analysis across the model domain.
Longitudinal Profiles
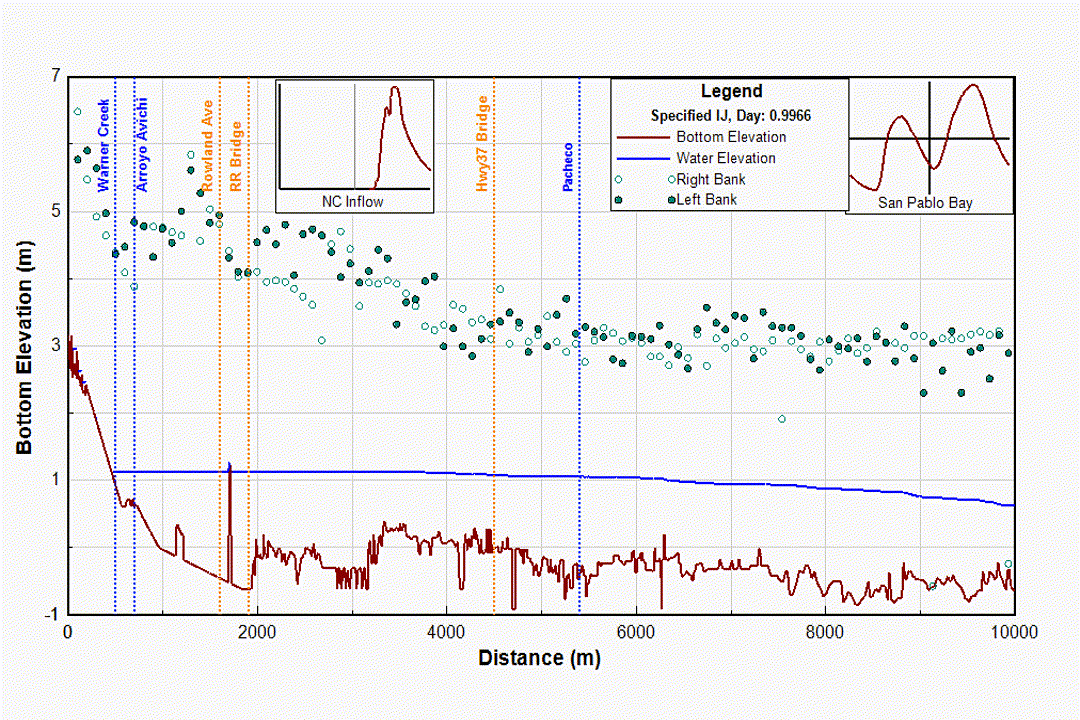
Longitudinal profile showing water and bank elevation.
Longitudinal Profiles
EE extracts and displays longitudinal profile plots for any parameter in the 2D map view. These produce XY line graphs for any layer or combination of layers along a defined path, clearly illustrating parameter variation along a water body’s length.