High-Resolution Marine Cadastre AIS Data for Propwash Modeling
Propeller wash (propwash) causes sediment scour in the seabed that can threaten the safety of structures in ports and harbors and cause environmental problems. Increased ship traffic exacerbates the sediment scour issue. For example, Wang et al., (2016) showed that berthing/docking at only three naval piers in San Diego Bay resuspended a total of 26 tons of sediment per day into the water column.
Our propwash blog series has demonstrated how the EFDC_Explorer Modeling System (EEMS) can simulate the effects of propwash on hydrodynamics and sediment transport. In this post, we demonstrate how to pre-process and visualize Automatic Identification Systems (AIS) ship track data in the EEMS propwash module, using the example of San Diego Bay in California. The processed data can then be used for propwash modeling.
Vessel traffic or AIS data can be imported to provide ship traffic and vessel characteristics needed for propwash modeling. MarineCadastre.gov provides free, high-resolution, real-time AIS ship traffic data collected by the U.S. Coast Guard for large vessels in U.S. and international waters. The data format has changed over the years, requiring different approaches for processing (Table 1). The ship track data includes the vessel’s Maritime Mobile Service Identity (MMSI), but this identifier is provided in encrypted form for the years 2010-2014. In this post, we used the data for July 2015, which includes unencrypted MMSI.
Table 1. Processing approaches for the MarineCadastre AIS Data for different years.
Data Year | Data Format | Data Processing Approach |
2009 – 2014 | Geodatabase format (*.gdbtable). | 1. Download monthly data for a specific Zone (*.zip). 2. Unzip data files. 3. Load data file (*.gdbtable) in QGIS and select data points in the region of interest. 4. Save the selected data points in CSV file format. |
2015 – 2017 | Comma Separated Values (CSV) format on a monthly basis | 1. Download monthly data for a specific Zone (*.zip). 2. Unzip data files. 3. Load data file (*.csv) in QGIS and select data points in the region of interest. 4. Save the selected data points in CSV file format. |
2018 – 2020 | CSV format on a daily basis. | 1. Use a Python script to download daily data for the year (*.zip and there are 365 or 366 files). 2. Use any scripting language to read all daily zip data files for a year and extract data points in the region of interest. Then save out to CSV files. 3. Load CSV file in QGIS and select data points in the region of interest. |
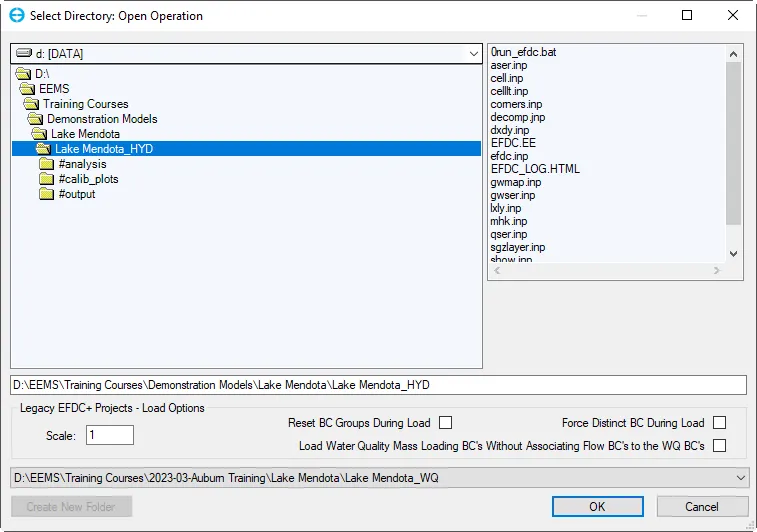
After processing the data as outlined in Table 1, you can import the CSV files into EFDC_Explorer (EE). Figure 1 shows how this appears in the EE form. EE recognizes the AIS information and will autofill the form. If needed, you can fill out or edit the forms manually. For example, in Figure 1, SOG represents “Column# for Speed,” and COG shows “Column# for Course.” The AIS data doesn’t provide the ship name, length, or breadth, but EE can get this information based on the MMSI through the “Get Online Ship Info” button shown in Figure 2.
EE can process the raw AIS data by filling in the missing data and splitting the tracks using time duration (hour) and track point distance (m), as shown in Figure 3. This processing is required to calculate more precise ship tracks, heading, and speed as the propwash model input files. Figure 4 shows 366 ships with 2246 ship tracks with a 1-minute temporal resolution in the San Diego Bay for July 2015.
After the AIS vessel track data is imported into EE, you must provide vessel dimensions, engine power, propeller properties, and hydrodynamic setup in the model to simulate depth-averaged ambient flow velocity, sub-grid flow velocity, and sub-grid bottom shear stress induced by the propeller wash. This information can be obtained using MMSI but is not always readily available. Depending upon the project needs, you may need to get this data from your client or make certain assumptions.
For this post, we have used one tugboat (TIOGA), as a representative example to simulate the propwash in San Diego Bay. EE can display the ship name, MMSI, gross tonnage, ship tracks, track point, date, time, Julian days, status, XY coordinate, ship speed, course, heading, and draft in 2DH View. You can combine the hydrodynamic features, propwash dataset, and GIS information and view them all together, as shown in Figure 5.
An animation of the TIOGA tugboat for a short time period is shown in Figure 6. The tugboat moves around the whole bay while the water elevation changes due to the tide. To see the jet impact of propeller momentum behind the ship, we have zoomed in on the area of interest. In the upcoming EEMS release (EEMS10.4), it will be possible to generate ship-focused animations as well (Figure 7).
If you want to try a propwash model in the free Demo Mode of EEMS, download the EEMS software and this canal model.
Figure 7. Jet impact of propeller momentum on the velocity field behind the ship
Reference:
F.Wang, I. D. Rivera-Duarte, K. Richter, Q. Liao, K. Farley, H. C. Chen, J. Germano, K. Markillie, and J. Gailani. Evaluation of resuspension from propeller wash in DoD harbors. Technical Report ER-201031, Department of Defense Environmental Security Technology Certification Program, United States, 2016.