The choice of turbulence closure scheme has important consequences on model results through mixing and circulation (Burchard et al., 1998). Several test cases were conducted to explore the performance of different turbulence closure options available in EEMS12 with the implementation of EFDC+/GOTM coupling. Results obtained with five different model configurations, including Mellor-Yamada (EFDC Original Approach); Mellor-Yamada (EEMS Preset for GOTM); k-ε (EEMS Preset for GOTM); k-ω (EEMS Preset for GOTM); and Generic (EEMS Preset for GOTM), were compared and investigated for each test-case. This blog describes the results of this comparison.
Comparisons to steady uniform open-channel flows are helpful for the validation of more complicated hydrodynamic models because the characteristics of such flows can be computed analytically following Chow (1959). In this blog, we discuss the results of an open channel test case based on the configuration described in Putzu et al. (2019). The analytical solution of the velocity profile U(z) can be computed as:
where
is the bottom friction velocity of the flow, is the non-dimensional von Karman constant (0.4), is the vertical coordinate of depth, is the relative bottom roughness (Nikuradse), is a non-dimensional conductance coefficient determined to be 8.5 for the current example.
The eddy viscosity can be computed analytically using a parabolic profile as:
where is the total flow depth, and all other variables are as defined previously.
Using Equation 1 and 2 with the specified parameters, the velocity profile, shear stress, and eddy viscosity can be determined.
The physical dimensions of the numerical model are specified as: Length (L), Width (W) = 1000, 50 m, respectively ; Bed Slope i = 0.001 m/m; horizontal grid dimensions dX, dY = 5, 5 m; bottom roughness zr = 0.001 m; and the number of vertical layers = 100. The upstream model boundary conditions were specified using a flow boundary condition, whereby the total flow was distributed uniformly with depth. The downstream model boundary was configured using a specified water surface elevation (free tangential). To produce steady and reproducible results, the model was initialized with a uniform water surface elevation of 1 m. This resulted in an initial depth of 1 m at the upstream end of the computational domain, and 2 m at the downstream end. The upstream flow boundary begins with an initial flow rate of 0 m3/s and is gradually increased to the maximum discharge of 300 m3/s at a rate of 0.1 m3/s2 over the course of 51 minutes. Simultaneously, the downstream boundary was initialized at 1 m above the model datum and gradually increased at a rate of 0.14 mm/s to reach the specified uniform water depth of 2.428 m in 51 minutes after the start of the simulation.
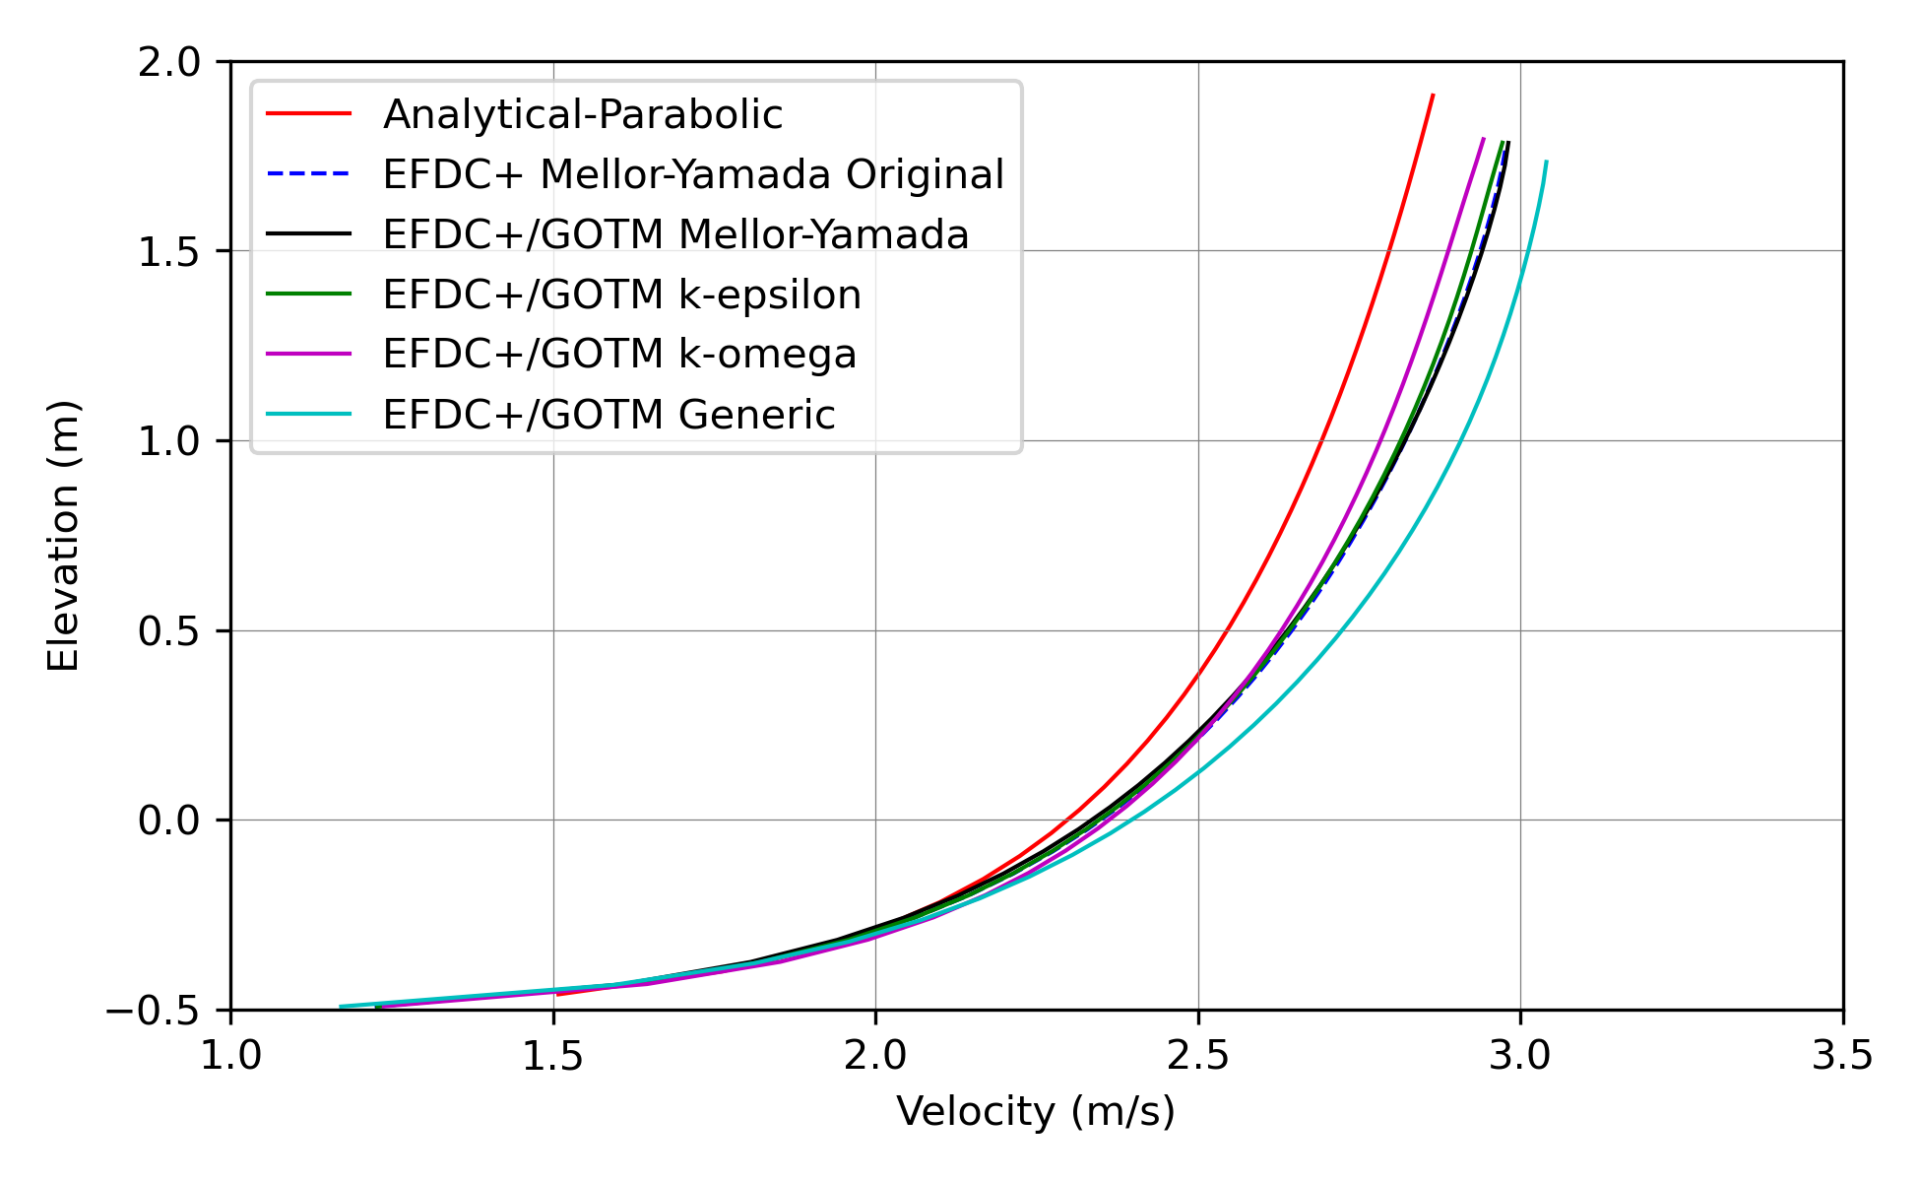
A comparison of the five model simulations with the analytically derived solution for the vertical profile of velocity is shown in Figure 1. All model simulations provide very close approximations to the logarithmic law of the wall within the log-law region of the flow. Within the log-law region, the flow velocity is primarily related to roughness elements within the viscous sub-layer. Outside of the log-law region, all the model simulations show similar trends in the velocity profile. This is especially true of the two Mellor-Yamada closure options from the EFDC+ original and the GOTM preset, which produced almost identical results. It is noted that for a reasonable comparison of the results, a correction to the wall function for open channel flow proposed by Blumberg et al. (1992) was used for the Mellor-Yamada closure in both EFDC+ original and GOTM preset.

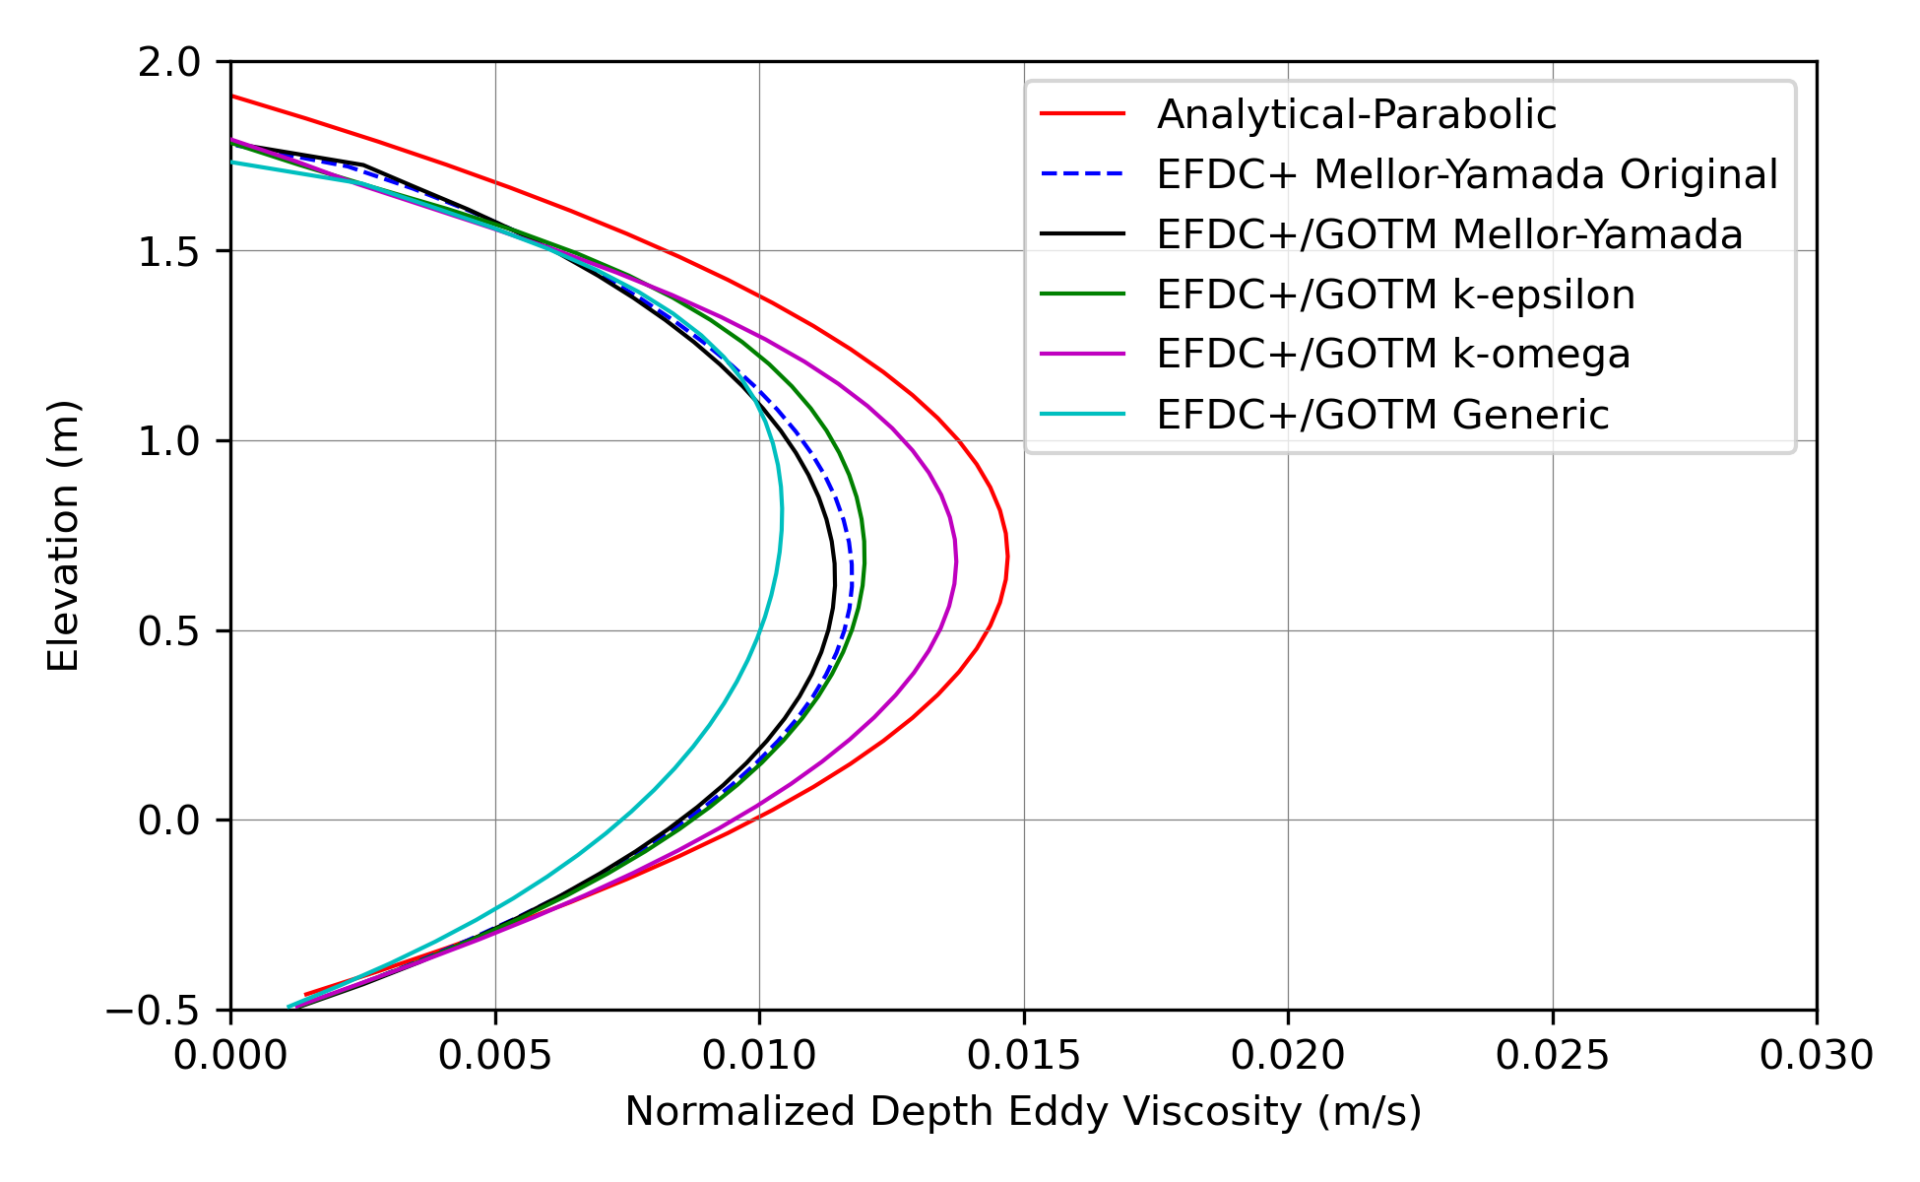
The vertical profile of eddy viscosity predicted by the different model configurations and the parabolic analytical solution are shown in Figure 2. Note that the parabolic eddy viscosity is based on the log-law velocity profile and is only valid in the log-law layer. Analytical models for flow velocity, depth, and eddy viscosity are two-dimensional and for uniform flows. In contrast, free-surface turbulent flows in river channels are strongly three-dimensional and non-uniform. Therefore, deviations are expected and reasonable when comparing a sophisticated three-dimensional model and an analytical two-dimensional model. Regarding the model predictions, it can be noted that, like the velocity profiles, all models tend to predict very similar magnitudes of eddy viscosity over the depth profile.
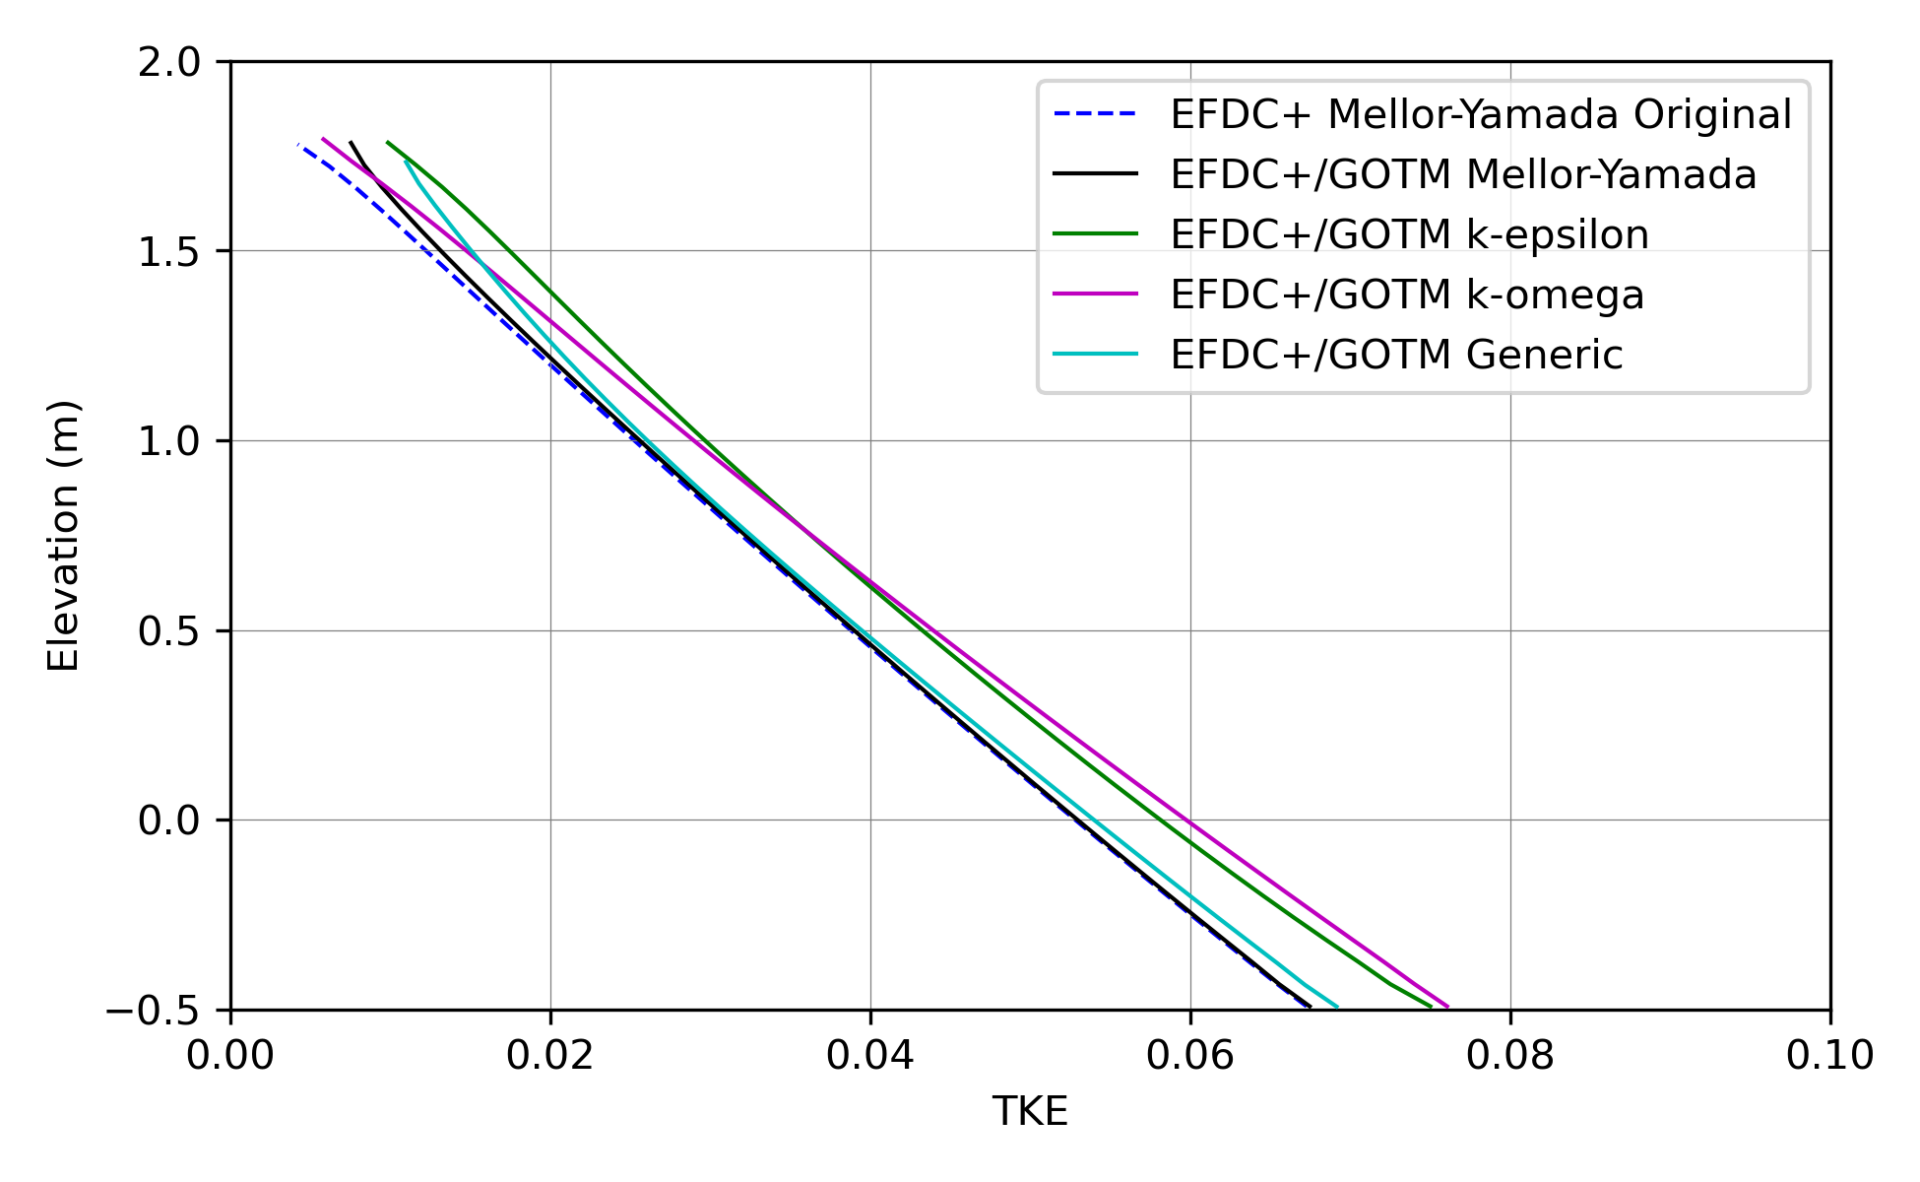
The vertical distribution of turbulent kinetic energy (TKE) within open channel flows reflects the balance between production and dissipation of TKE. In the open channel example, the production of TKE is related to interactions with roughness elements within the viscous sub-layer. This leads to an approximately linear distribution, as shown in Figure 3. It can be observed from Figure 3 that all parameterizations for turbulence closure considered in this example produce similar profiles.


In conclusion, the results of the five closure approaches, when compared to the two-dimensional analytical solution, demonstrated that each model produces comparable results. As an example of steady uniform open channel flow, subject only to the effects of viscosity and gravity relative to the inertial forces of the flow, this test case demonstrates that the coupling between EFDC+ and the GOTM subroutines was correctly implemented. Additionally, these results show that each model can produce results that are physically realistic and comparable to simplified two-dimensional analytical approximations typical in the analysis of open channel flows.
References:
Burchard, H., Baumert, H., 1998. The formation of estuarine turbidity maxima due to density effects in the salt wedge. A hydrodynamic process study. J. Phys. Oceanogr. 28, 309–321.
Ven Te Chow. Open-channel hydraulics. Caldwell. 1959.
Putzu, S.; Enrile, F.; Besio, G.; Cucco, A.; Cutroneo, L.; Capello, M.; Stocchino, A., 2019. A reasoned comparison between two hydrodynamic models: Delft3D-Flow and ROMS (regional oceanic modelling system). J. Mar. Sci. Eng, 7, 464.
Blumberg, A.F., Galperin, B., OConnor, D.J., 1992. Modeling vertical structure of open-channel flows. J. Hydr. Eng. 118 (H8), 1119–1134.


