Comparative Study of Turbulence Models in Modeling Lake Mendota’s Thermal Behavior
Introduction
Lake Mendota, the largest lake in Madison, Wisconsin, exhibits complex thermal dynamics with pronounced summer stratification and reverse winter stratification under ice cover. The lake monitoring benefits from extensive, high-resolution data collected by the North Temperate Lakes Long-Term Ecological Research (NTL-LTER) project.
In this study, DSI developed a hydrodynamic model of Lake Mendota’s thermal dynamics using the EFDC+ Explorer Modeling System (EEMS). Given that the choice of turbulence models, such as the Mellor-Yamada models, the k-ε model, or k-ω model, plays a critical role in simulating the vertical lake temperature dynamics, the primary objective of this study is to assess the model’s sensitivity to different turbulence closures, thus aiming to provide a valuable reference for future thermal calibration efforts.
Model Configurations
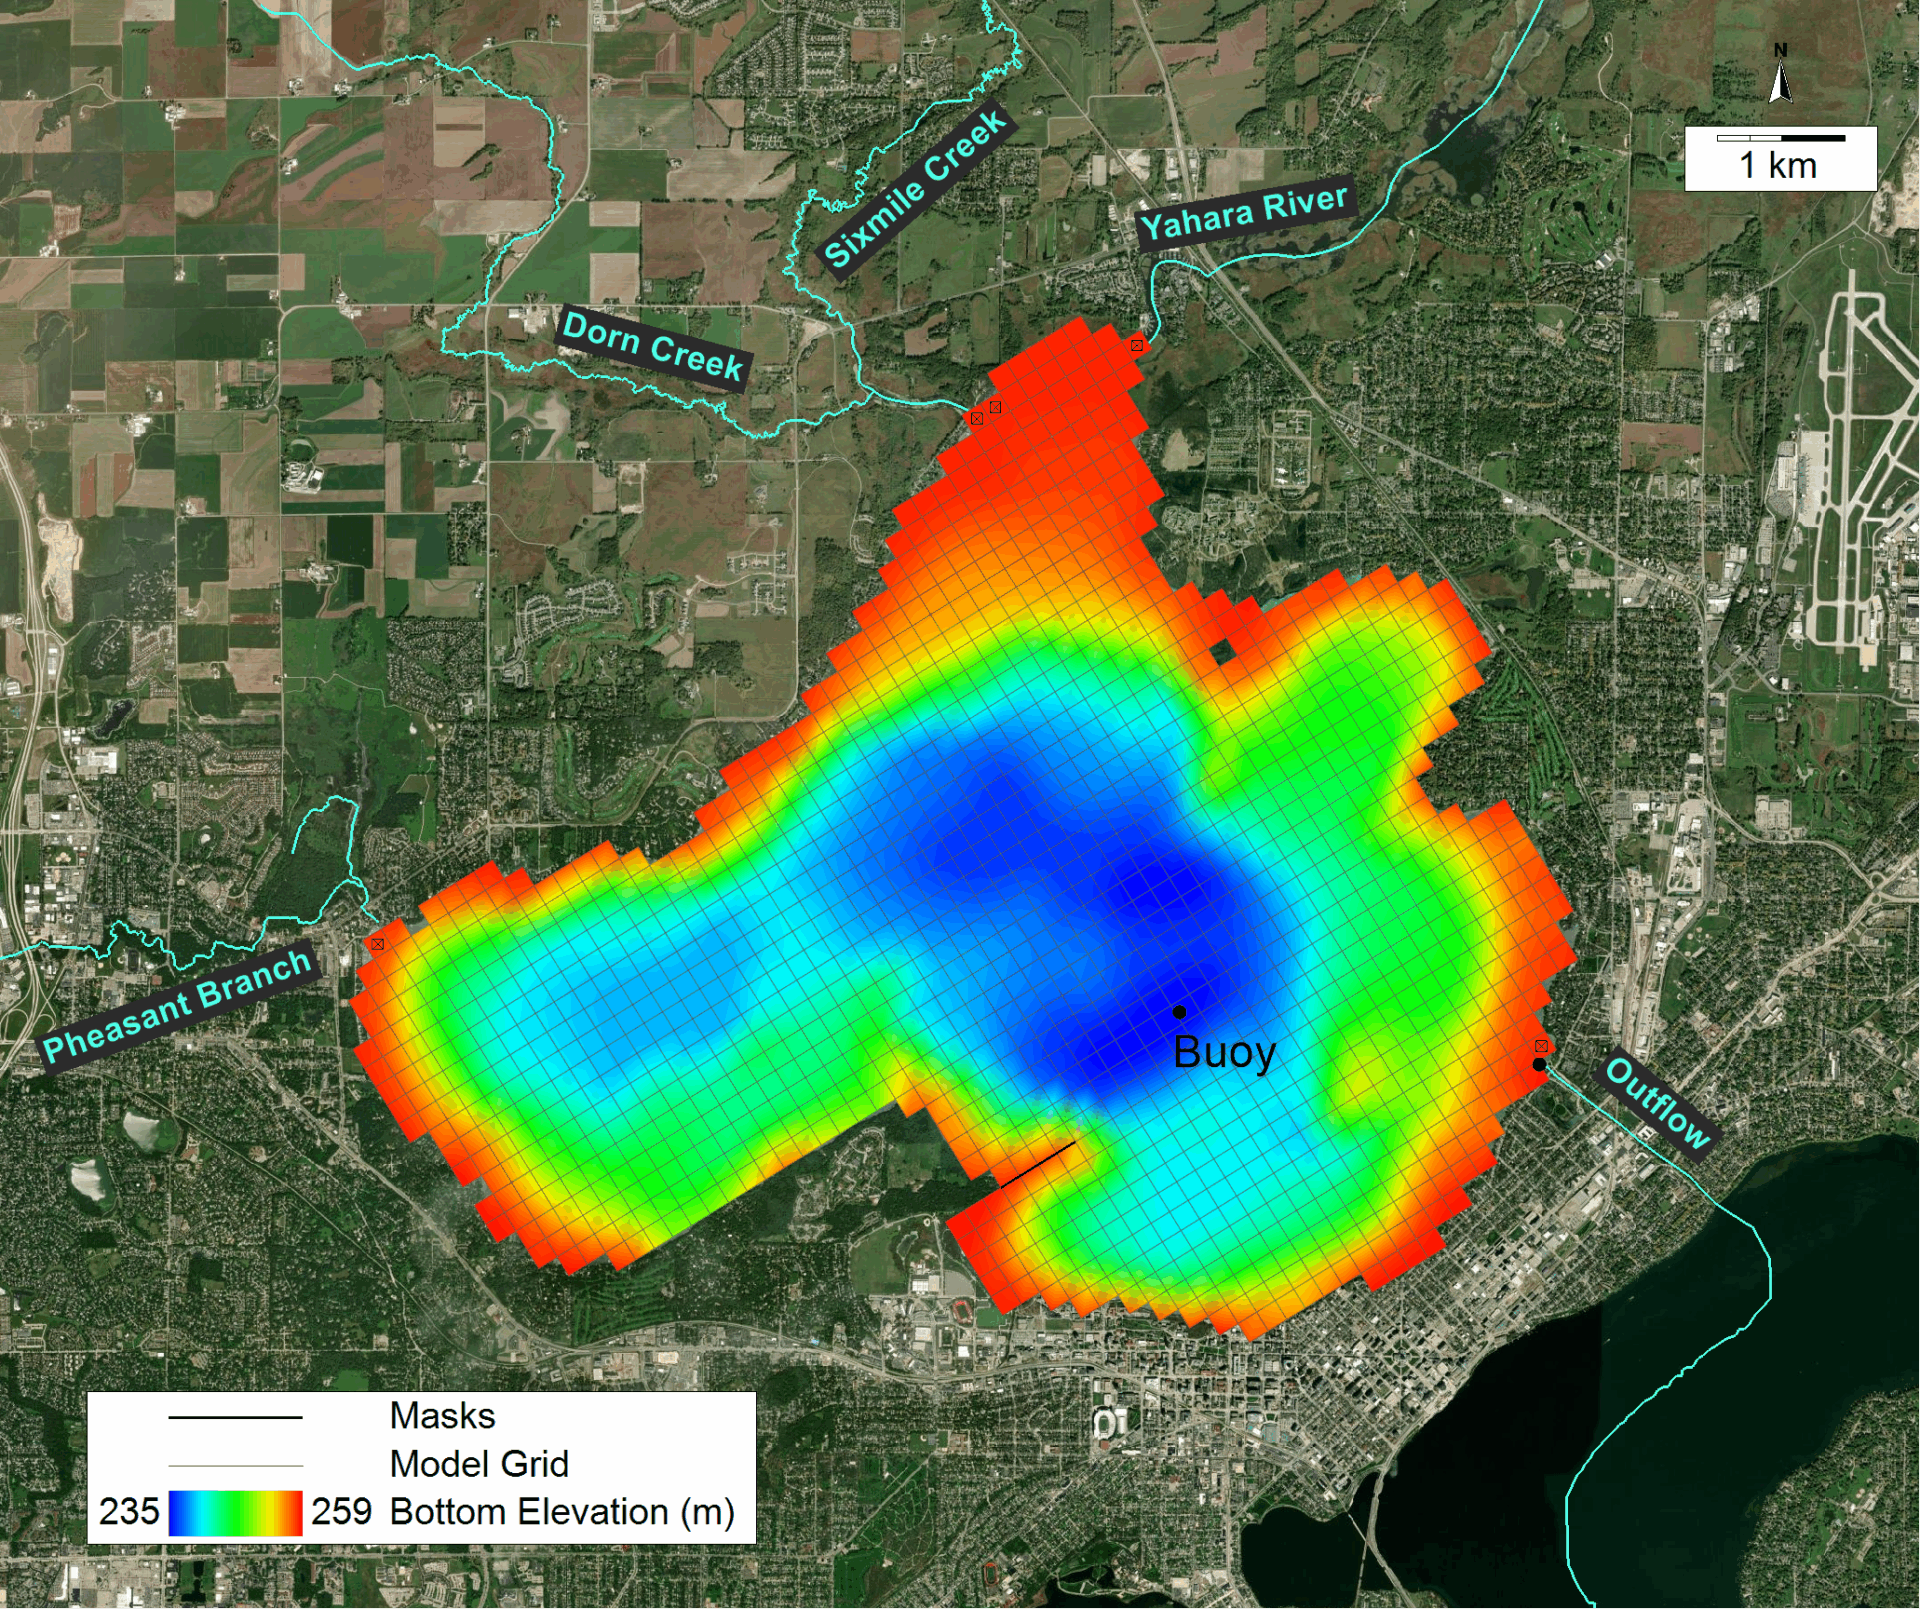
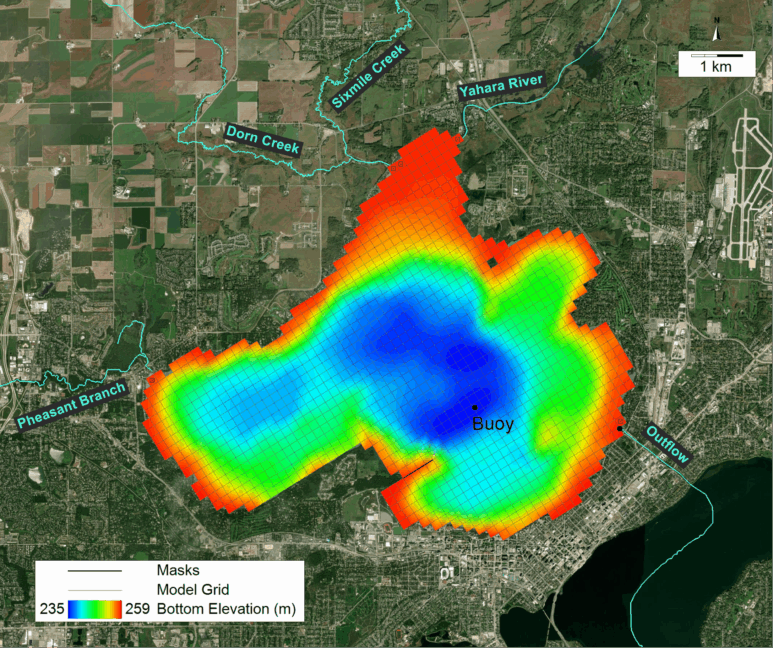
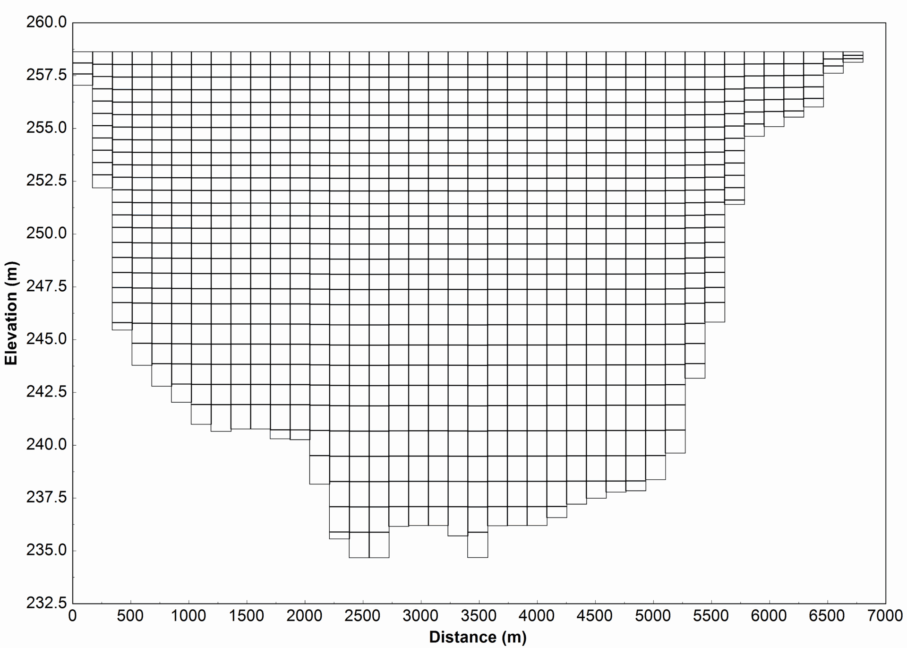
The EFDC+ model setup for Lake Mendota utilizes a high-resolution 3D grid comprising 1,405 horizontal cells (49 rows by 58 columns), as shown in Figure 1. The model uses a Sigma-Zed coordinate system with 30 layers (Figure 2), which allows for precise stratification modeling across varying depths. This structuring approach provides robust coverage from the lake’s surface to its bottom topography, ensuring accurate simulation of hydrodynamic and thermal processes.
The model runs for one year, from January 1st, 2020, through January 1st, 2021, to capture the annual cycle of thermal stratification. The EFDC+ Full Heat Balance model was selected to simulate the water surface heat exchange. Regarding the vertical mixing, four different models were tested, including Mellor-Yamada (EFDC Original Approach), Mellor-Yamada (GOTM Approach), k-ε (GOTM Approach), and k-ω (GOTM Approach).
Impacts of Different Turbulence Models on Temperature
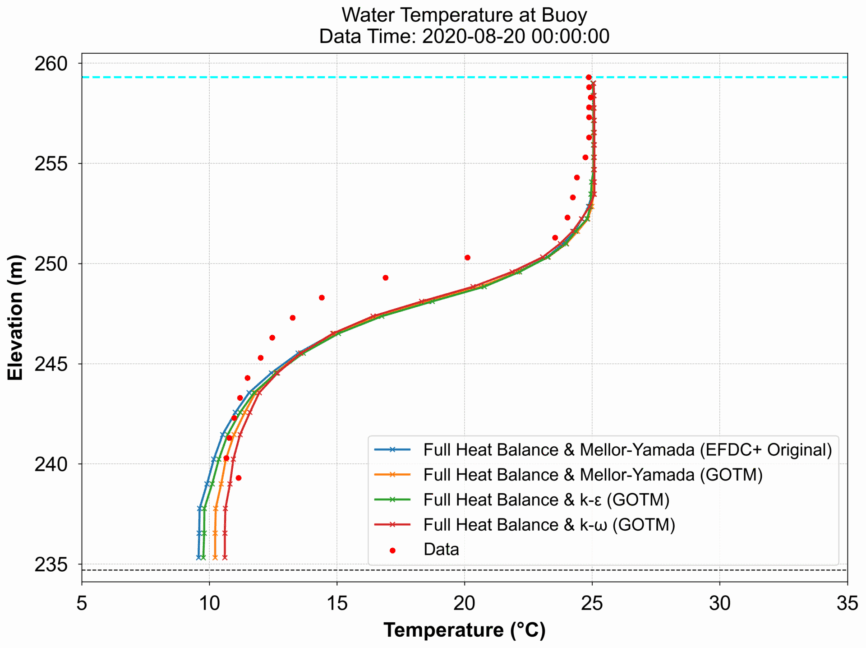
To assess the impact of different turbulence models on model performance, we simulated temperature profiles and compared them with hourly observed data at the lake’s deepest point (Buoy) in 2020. The comparison involved 23 vertical measurement points from 0 to 20 meters. As shown in Figure 3 and Table 1, all model configurations demonstrate strong agreement between observed and predicted temperatures across the water column, with only slight reductions in accuracy at greater depths.
Table 1. Model statistics of 0-m and 19-m temperatures simulated using different turbulence options
| Model Configurations | Depth | # Pairs | Mean Observed | Mean Simulated | R2 | ME | MAE | RMSE | SRMSE | SS |
| Mellor-Yamada (EFDC+ Original Approach) | 0 | 5542 | 17.14 | 11.41 | 0.99 | -0.23 | 0.57 | 0.79 | 0.05 | 0.99 |
| Mellor-Yamada (EFDC+ Original Approach) | 19 | 5542 | 9.89 | 6.74 | 0.81 | -0.43 | 0.67 | 0.82 | 0.08 | 0.81 |
| Mellor-Yamada General Ocean Turbulence Model (GOTM) | 0 | 5542 | 17.14 | 11.41 | 0.99 | -0.23 | 0.59 | 0.81 | 0.05 | 0.99 |
| Mellor-Yamada General Ocean Turbulence Model (GOTM) | 19 | 5542 | 9.89 | 6.9 | 0.82 | -0.16 | 0.57 | 0.78 | 0.08 | 0.82 |
| k-ε (GOTM) | 0 | 5542 | 17.14 | 11.38 | 0.99 | -0.27 | 0.58 | 0.81 | 0.05 | 0.99 |
| k-ε (GOTM) | 19 | 5542 | 9.89 | 6.83 | 0.84 | -0.26 | 0.56 | 0.74 | 0.07 | 0.84 |
| k-ω (GOTM) | 0 | 5542 | 17.14 | 11.41 | 0.99 | -0.25 | 0.59 | 0.82 | 0.05 | 0.99 |
| k-ω (GOTM) | 19 | 5542 | 9.89 | 7.02 | 0.84 | 0.04 | 0.5 | 0.76 | 0.08 | 0.84 |
The temporal comparisons illustrated in Figure 4 highlight the model sensitivity across water column depths. Among the turbulence models, the k-ω scheme (GOTM) yielded the most accurate results in the deeper layers of the lake. The vertical mixing schemes greatly impacted temperature accuracy in the bottom layers. These findings underscore the importance of selecting appropriate parameterizations for internal mixing to enhance model fidelity in lake thermal simulations.
In summary, the Lake Mendota case study evaluated various turbulence models embedded in the EFDC+ framework, aiming at capturing the lake stratification and the thermal seasonality. Comparison with extensive observational data demonstrated EFDC+’s high accuracy in replicating seasonally- and depth-varying temperatures.
Conclusion
This study reinforces EFDC+ Explorer as a premier tool for lake modeling. The robust hydrothermal dynamic modules suggest EFDC’s widespread applicability in ecological management, regulatory compliance, and climate adaptation planning.
View an animation of the Lake Mendota model here:


