This blog discusses the results of a free convection test case performed with different turbulence closures available in EEMS 12. The test case is intended to demonstrate the development of a surface mixed layer in a stably stratified fluid cooled from above by the EFDC+ model. The scenario of the free convection simulated here is similar to the numerical experiment of Van Roekel et al. (2018), the field study and numerical model of Large et al. (1994), and the laboratory experiment of Behnia and Viskanta (1979).
The natural convection in a thermally stratified layer of water cooled from the free surface is a very complex phenomenon because several energy transport processes must be considered simultaneously. Experimental evidence indicates that the vertical temperature structure near the air-water interface is usually composed of several regions depending on, in the case of natural waters, atmospheric conditions (Behnia and Viskanta 1979). Behnia and Viskanta 1979 also introduced a simplified numerical solution for the thickness of the convective mixed layer under constant surface heat flux:
The dimensionless time is defined as:
where:
is the convective (mixed) layer thickness;
is the subscript indicating the initial time;
is the (dimensionless) time variable total heat flux at the water surface (z = 0) taken as the sum of sensible, latent, and radiative energy fluxes;
is a proportionality factor that lies between zero and unity established from experimental data; is the density of water;
is time;
is the thermal diffusivity;
is the thickness of the surface skin layer;
is the specific heat of water; and
is the temperature gradient.
Behnia and Viskanta (1979) demonstrated that mean values of κ between 0.25 and 0.35 provide a good fit to experimental data. For an experimental duration greater than 3 minutes, the numerical solution is insensitive to the value of κ. Therefore, the choice of a constant value is not a limitation to the range of applicability of this simplified model. Note that based on the comparison of the Behnia and Viskanta (1979) analytical solution to experimental data, both the degree of heat flux applied and the duration of the experiment result in the divergence of the analytical solution and experiment data in several instances. Therefore, we do not anticipate the numerical turbulence closure models to exactly reproduce the analytical solution. Because the analytical solution can underpredict or overpredict the mixed layer depth experimental results, we expect some degree of convergence with the closure models evaluated for this example.
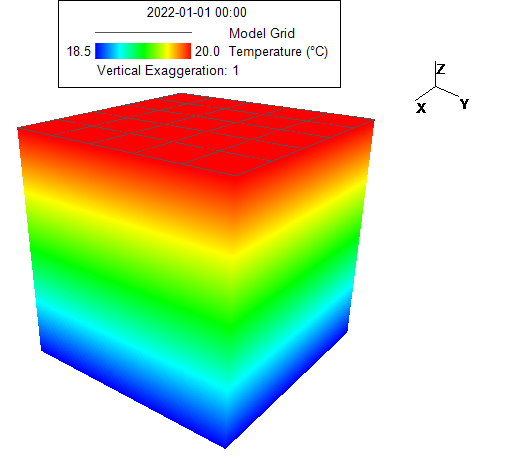
The configuration (Figure 1) of the numerical model was specified as: Length (L), Width (W) = 150, 150 m, respectively; horizontal grid dimensions dX, dY = 30, 30 m; total water depth H = 150 m; and the number of vertical layers = 150. The initial stratification was defined as a linear function with a surface temperature of 20 °C and a bottom temperature of 18.5 °C. The only forcing condition in the model was a constant negative surface heat flux of 75 W m⁻². The effects of side-wall friction and horizontal eddy viscosity were not included in the simulation. Results obtained with five different model configurations, including Mellor-Yamada (EFDC Original Approach); Mellor-Yamada (EEMS Preset for GOTM); k-ε (EEMS Preset for GOTM); k-ω (EEMS Preset for GOTM); and Generic (EEMS Preset for GOTM), were compared and investigated.
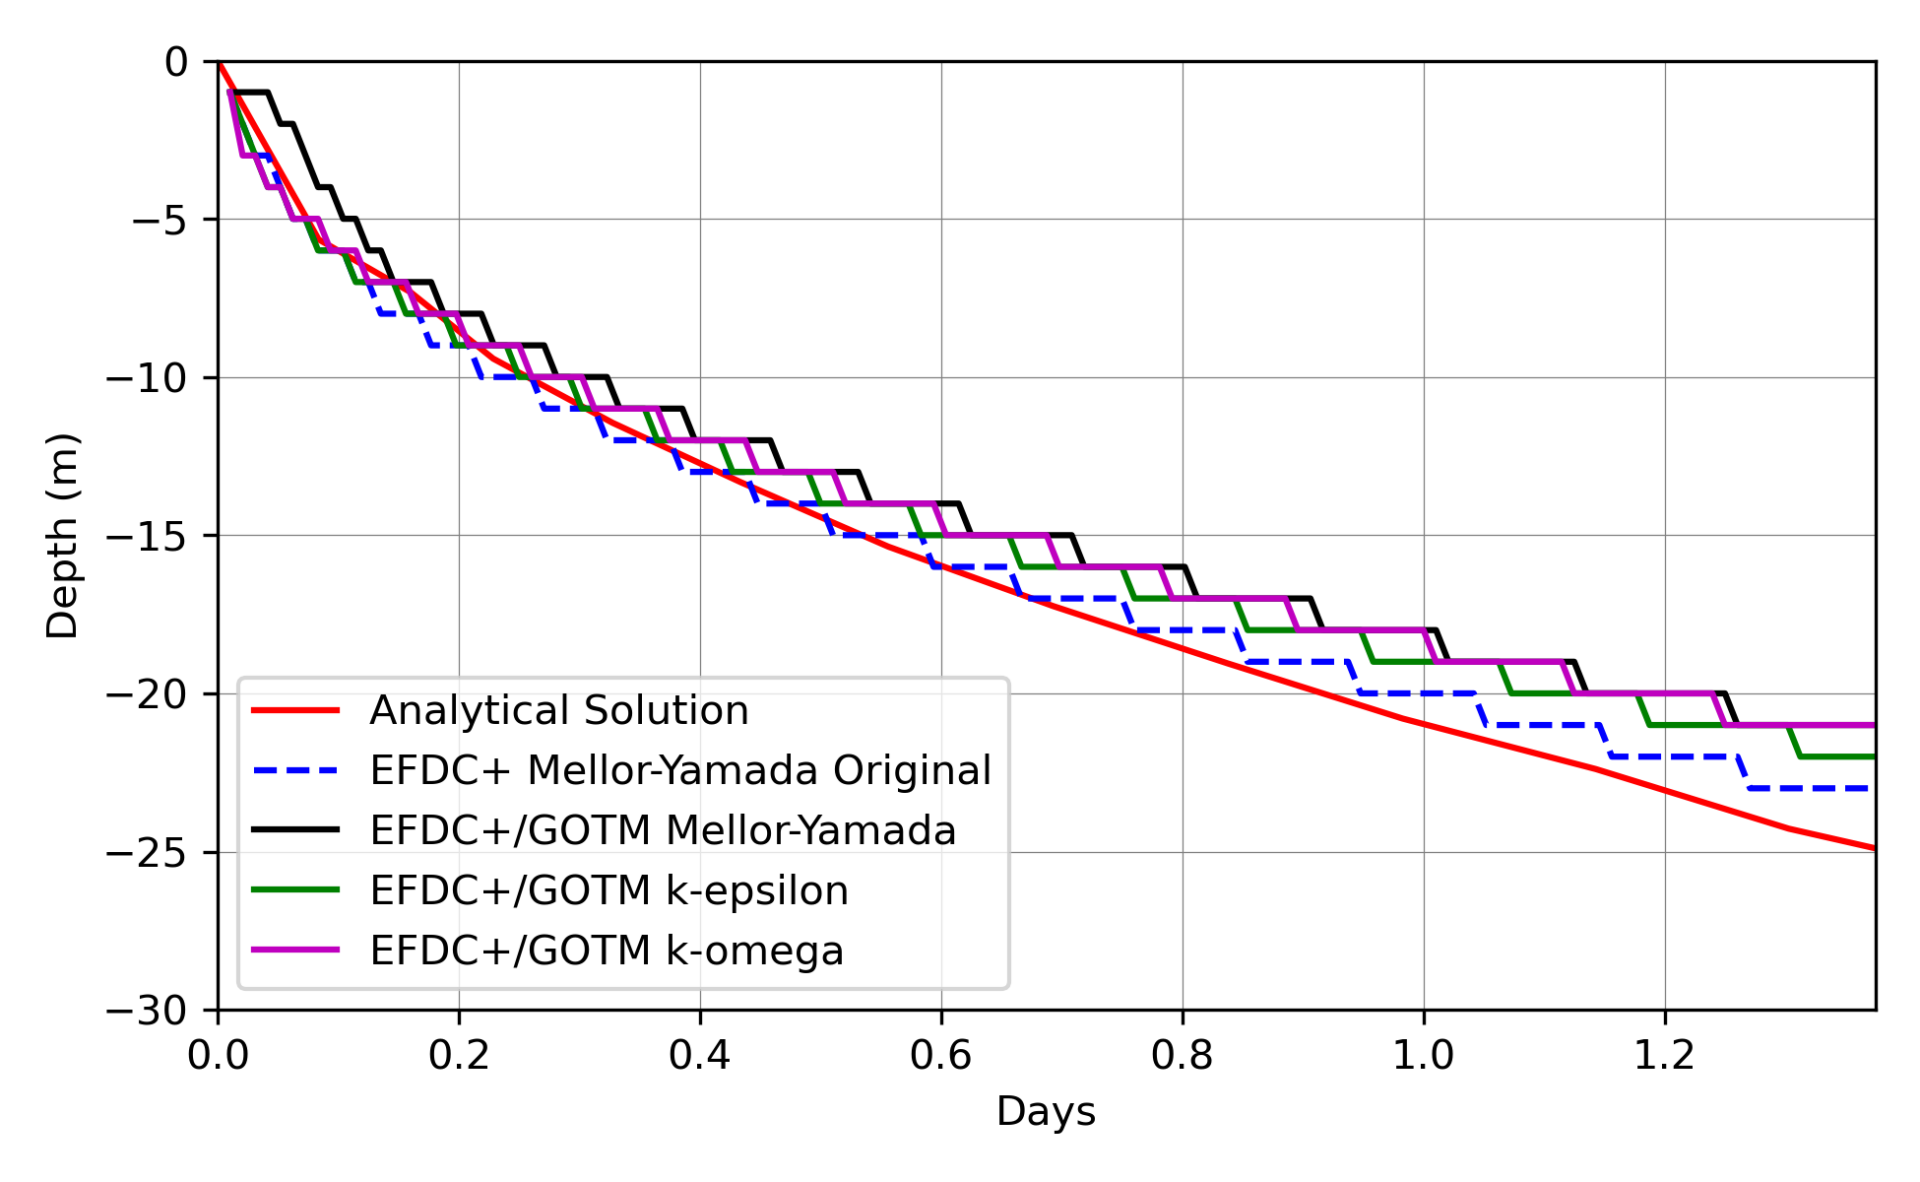
Compared to the analytical solution, all numerical models somewhat under-predicted the evolution of the mixed layer thickness by the end of the simulation (Figure 2). Based on the experimental data used by Behnia and Viskanta (1979), this may, in some cases, produce better results compared to experimental data than the analytical solution. Also, in comparing the numerical model results evaluated here to the numerical model results presented in Van Roekel et al. (2018), it can be observed that the results of that study also generally underpredicted the mixed layer thickness predicted by the analytical model, especially in the cases where a higher vertical grid resolution was applied.


Nearly all of the numerical model configurations closely predicted the evolution of the mixed layer depth shortly after the initialization of the experiment. The only notable divergence from the analytical solution occurred in the GOTM-based parameterization of the Mellor-Yamada approach at the beginning of the simulation. However, within about 5 hours from the start of the simulation, all of the numerical models generally converged with the analytical solution. All numerical model solutions tended to track with the analytical solution from 5 hours to 10 hours from the start of the simulation.
The pattern of the numerical model results regarding the mixed layer depth shows a staircase pattern in all cases. This pattern was consistent with the results of the numerical simulation of Van Roekel et al. (2018) and was a consequence of vertical discretization of the model. Essentially, once the gradient Richardson number becomes sufficiently large, successive layers of the model begin to mix rapidly. Therefore, the staircase pattern of the numerical model results reflect the point at which vertical mixing occurs between layers.
In conclusion, the results of the free convection test case demonstrated that all the numerical closure models evaluated for this example could reasonably reproduce the predictions of the analytical solution. The EFDC+ Original Mellor-Yamada approach provided the closest fit to the analytical model.
References:
M. Behnia and R. Viskanta. “Free convection in thermally stratified water cooled from above”. International Journal of Heat and Mass Transfer 22.4 (Apr. 1979), pp. 611– 623. ISSN: 00179310.
Van Roekel, L., Adcroft, A. J., Danabasoglu, G., Griffies, S. M., Kauffman, B., Large, W., et al. (2018). The KPP boundary layer scheme for the ocean: Revisiting its formulation and benchmarking one-dimensional simulations relative to LES. Journal of Advances in Modeling Earth Systems, 10(11), 2647–2685.


