In a recent blog, we highlighted some of the recent enhancements to the jet and plume features in EEMS. This blog looks in more detail at these improvements and how we tested them by comparing them to the CORMIX modeling software.
The original EFDC+ Jet/Plume module was intended to model the effects of a plume in a relatively large scale model, such as a river section or part of the coastline. Recently, we have been working to improve this feature so that EFDC+ can capture the details of the plume movement on a more local scale. Compared to tens or hundreds of meters cell size in the usual model domain, we tested the model with a finer grid (a couple of meters) to inspect the jet/plume behavior in the upcoming release.
Assumptions for EFDC+ Jet Plume Simulation

The calculation procedure of the jet and plume module is mainly based on Lee and Cheung (1990), who developed a general Lagrangian jet model formulation for an inclined buoyant jet in a current with a three-dimensional trajectory. The plume gains mass as ambient fluid is entrained and mixed within it, but once entrained, the new mass becomes an indistinguishable part of the plume. In the simplest version, the plume is assumed to be essentially a cylindrical segment whose radius grows as mass is entrained. The initial plume mass is identified as the mass issuing from a diffuser with radius:
where h₀ is the and is chosen to be comparable to b₀. For example, h₀ = r and b₀ = r, where r is the radius of the diffuser.
The increment in the plume mass at the time step nth is evaluated as the sum of the plume mass increment due to the shear-induced entrainment and the forced entrainment.
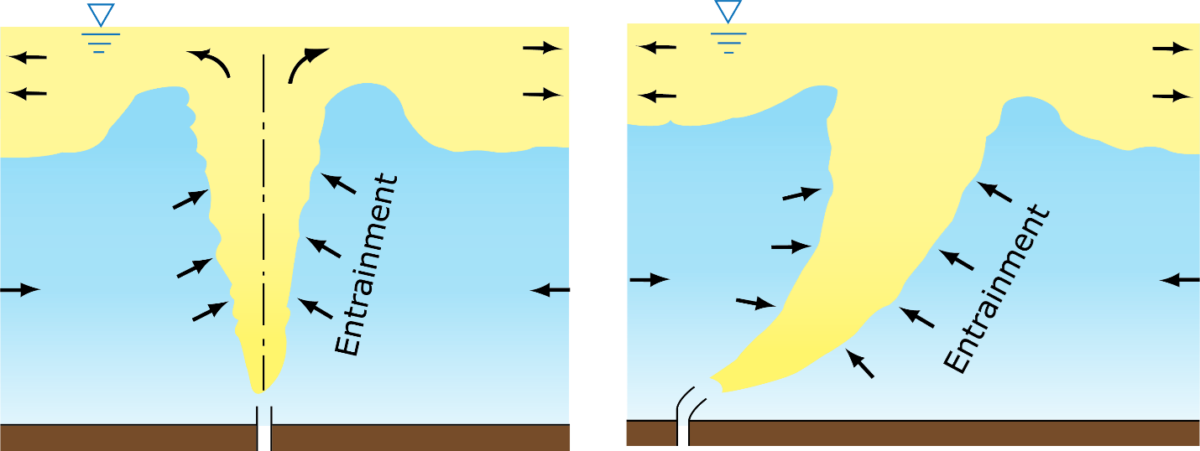
In equation (2), ΔMₛ is the increase in mass due to shear entrainment, and ΔMf is the increase in mass due to forced entrainment. A schematic of a rising plume discharged into a water body is shown in Figure 1. The shear-induced entrainment is computed as a function of the local densimetric Froude number and jet orientation, whereas the forced entrainment is taken as the ambient flow intercepted by the “windward” side of the buoyant jet.
The Lee & Cheung model was found to be consistent with the concept of asymptotic flow regimes and reproduces the in both the near and far-field of a vertical momentum of a buoyancy-dominated jet in a cross flow.
In terms of forced entrainment, experimental observations by Chu and Goldberg (1984) and Stuart Churchill (1975) have shown that the transfer of horizontal momentum is complete beyond a few jet diameters. We assume that all the ambient flow on the downdrift side of the plume is entrained into the plume element.
CORMIX Introduction
CORMIX is a commercial mixing zone model used for environmental impact assessments. CORMIX uses CorJet, an advanced integral model tool for detailed near-field analysis of single stable port and multiport discharges in these simulations. The integral model uses hydrodynamic equations governing the conservation of mass and momentum, and other quantities such as pollutant mass, density deficit, temperature, and/or salinity are solved stepwise along the general curved jet trajectory. For more details about CORMIX please refer to their users manual.
Test Case Setup
For this comparison test, we built a simple 2D flow system with one discharge port 70 meters below the water surface, with a total depth of 100 meters for both CORMIX and EFDC+. The water temperature is set 28 oC at the top and 26 oC at the bottom, with a linear transition in between. Both models have an ambient flow velocity of 0.04 m/s, and discharge temperature is set at 30 oC, allowing the jet to have a positive buoyant force upon release. The EFDC+ domain is 382.5 x 7.5 x 100 m channel (L x W x D, meters) with 20 vertical layers. The single nozzle is set at the channel centerline, 135 m downstream of the inflow boundary. One main difference between the two models is that CORMIX has an infinite flume width.
First Test Series – Varying Discharge
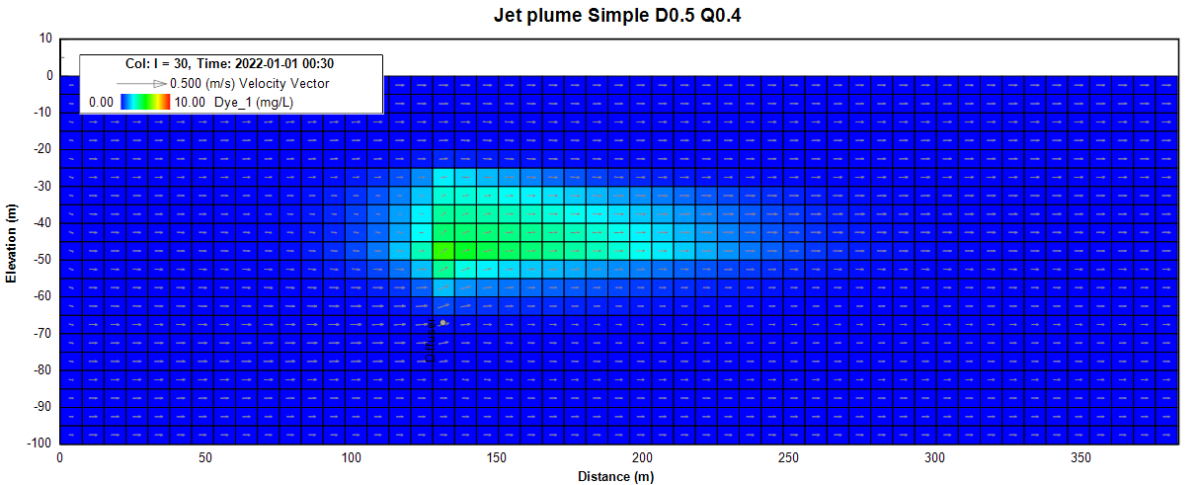
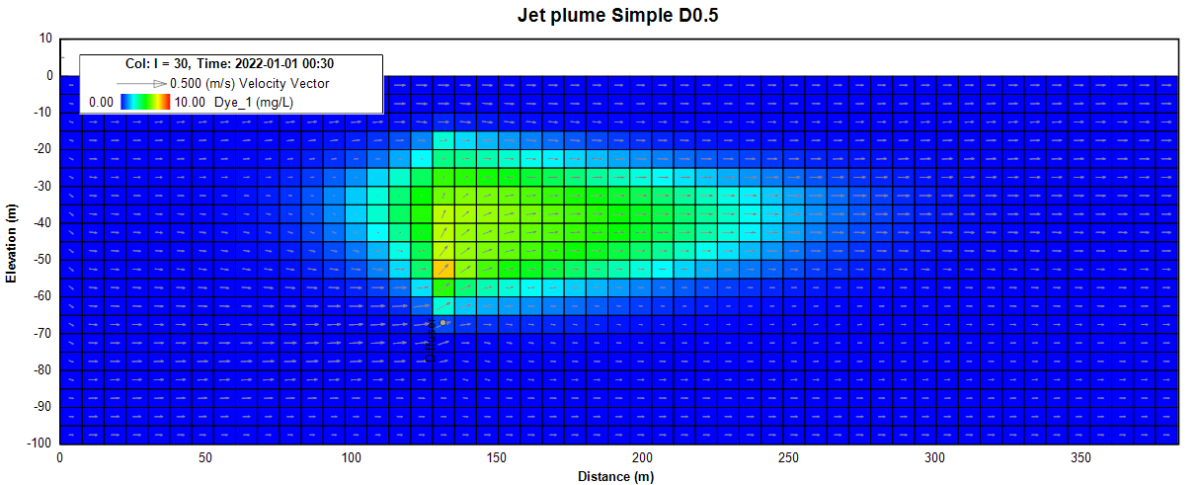
In the first test series, the discharge rate was altered in a range from 0.2 cms to 1 cms. The port diameter is fixed at 0.5 m. The vertical profile plots in show the result of each run. The first thing to notice is that the plume size is proportional to the discharge rate. Furthermore, the trailing edge of the plume is advected downstream by the ambient flow after the plume reaches its neutral buoyancy level in the discharge cell. The velocity vector also shows that the ambient flow is redirected upwards due to the entrainment. One can also notice the small circulation at the head of the plume due to shear forces between fluids with different densities.

Second Test Series – Varying Port Diameter
In the second set of tests, the port diameter was adjusted, and the discharge rate was fixed at 1 cms. The results are shown in the animation in Figure 3. The initial jet velocity in this run set is high and exceeds normal design criteria. For example, the initial jet velocity out of a 1 m diameter port discharging at 1 cubic meter per second equals 32 meters per second. This velocity is considered unreasonable for a practical design as it can endanger aquatic species in the vicinity of the discharge port.

Conclusion
In the tables below, the initial jet velocity and the final plume levels for each run are provided. The corresponding CORMIX plume neutral level is also provided for comparison. With a slower and smaller range of port velocity in the first test series (Table 1), the EFDC+ result remains stable between -45 to -35 meters. This is similar to the CORMIX result. The second test series (Table 2) has a faster and broader port velocity range. The current EFDC+ result shows a different trend in the equilibrium depth to that of CORMIX as the port velocity increases. Both test series show that the final plume neutral buoyancy level is close when the initial jet velocity is below 5 m/s. These results illustrate that the current EFDC+ jet/plume result is capable of simulating general design criteria even under a more refined grid resolution for port velocities lower than 5m/s.

Table 1. Details of initial jet velocity and final plume levels for varying discharges. *CORMIX plume suddenly drops towards the bottom with this setting and was considered as a result outlier.

Table 2. Details of initial jet velocity and final plume levels for varying diameters.
Current Limitations and Future Developments
Current limitation in EFDC+ includes releasing jets at an angle. In our test case, we released the jet vertically upwards. If users set the port to release at an angle, EFDC+ will currently still disperse the plume directly on top of the release cell, then transport downstream by the ambient flow.
Another known issue is the momentum calculations during plume growth. This issue affects the neutral plume level result in the second test series when the initial jet velocity is above 5 m/s. Currently, EFDC+ shows the neutral plume level becomes higher as the initial jet velocity decrease, this trend contradicts with the CORMIX result and DSI is still working on resolving this issue.
Besides resolving the limitation and known issue, DSI continues to work on improving and validating the jet/plume module, so EFDC+ can encompass a more comprehensive application range and provide more detailed information.
References
Lee, J. H. W., and V. Cheung (1990), Generalized Lagrangian model for buoyant jets in current, J. Environ. Eng., 116(6), 1085– 1106, doi:10.1061/(ASCE)0733-9372(1990)116:6(1085).
Doneker, R.L. and G.H. Jirka, “CORMIX User Manual: A Hydrodynamic Mixing Zone Model and Decision Support System for Pollutant Discharges into Surface Waters“, EPA-823-K-07-001, Dec. 2007. Available for download at http://www.mixzon.com/downloads/


