Zooplankton population modeling is a significant new feature in the recently released version of EFDC+ Explorer Modeling System (EEMS 10.3). Built as a sub-module of the Water Quality module, the new zooplankton feature is a first step toward modeling the effects of eutrophication on higher-level predators. In this blog post, we introduce a numerical simulation of hydrodynamics, temperature, and water quality in Lake Thonotosassa, Florida for the period January 07, 2012, through December 28, 2012. The goal is to demonstrate the capability of EFDC+ to reproduce the kinetics of the zooplankton population, which forms an essential link in the food web of the lake.

Model Description
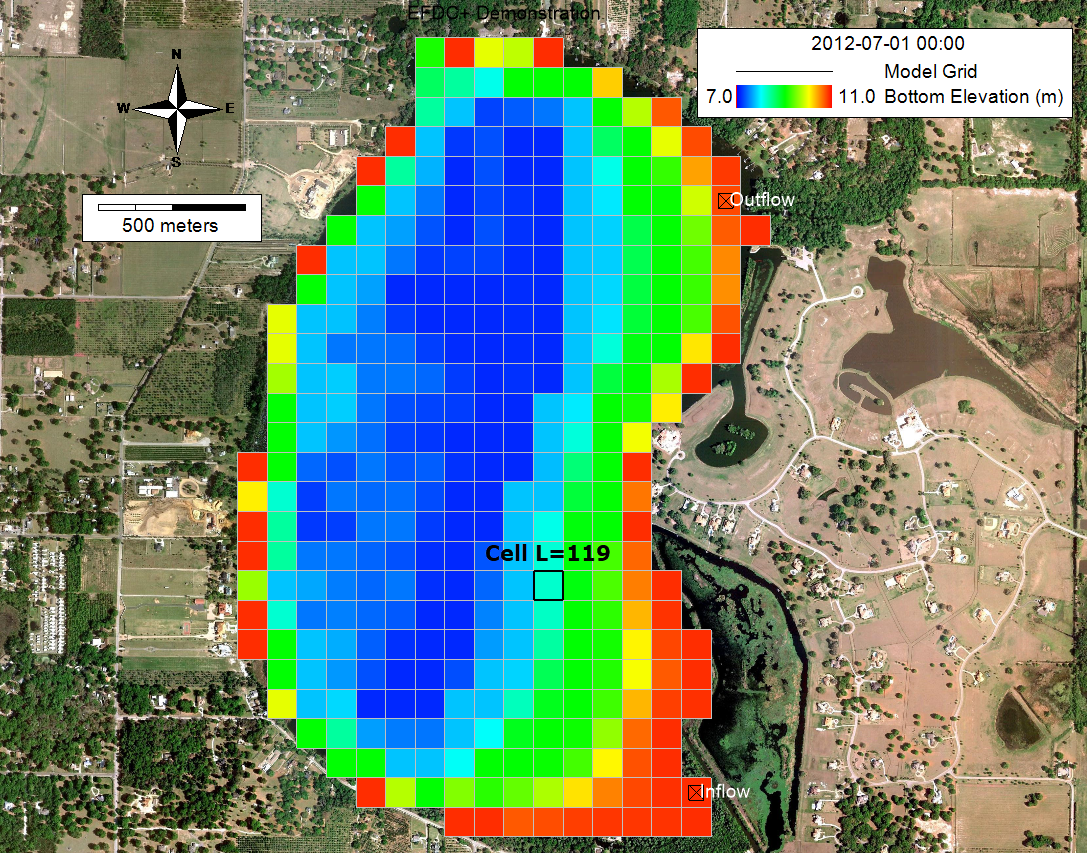
The digital terrain model for Lake Thonotosassa and the location of its tributaries are shown in Figure 1. The Lake Thonotosassa water quality model simulated organic carbon, nitrogen, phosphorus, and dissolved oxygen. The biota species included in the model consist of phytoplankton (green algae), and a group of zooplankton. Apart from zooplankton, each simulated water quality constituent has a time series value as an external source at the inflow tributary. An initial concentration of 0.1 mg C/L of both zooplankton and green algae was distributed throughout the lake. Model parameters of zooplankton and green algae are listed in Table 1 and Table 2, respectively.
| Parameters | Value |
|---|---|
| Nitrogen to Carbon ratio (gN/gC) | 0.2 |
| Phosphorus to Carbon ratio (gP/gC) | 0.02 |
| Carbon threshold for gazing (gC/m3) | 0.05 |
| Prey density at which gazing is halved (gC/m3) | 0.175 |
| Max ration of zooplankton (g prey C/g zooplankton C/day) | 1.0 |
| Basal Metabolism rate at reference temperature (1/day) | 0.186 |
| Reference temperature for basal metabolism (°C) | 20 |
| Effect of temperature on basal metabolism (1/°C) | 0.069 |
| Predation rate at reference temperature (1/day) | 0.2 |
| Reference temperature for predation (°C) | 20 |
| Effect of temperature on predation (1/°C) | 0.069 |
| Critical DO below which death occurs (g DO/m3) | 2 |
| Zooplankton death at zero DO concentration (1/day) | 4 |
Table 1: Zooplankton parameters
| Parameters | Value |
|---|---|
| Carbon to Chlorophyll Ratio (mg C/µg Chl ) | 0.2 |
| Nitrogen to Carbon ratio (gN/gC) | 0.167 |
| Settling velocity (m/day) | 0.1 |
| Maximum growth rate (1/day) | 3.5 |
| Photosynthesis oxygen-to-carbon ratio | 2.67 |
| Phosphorus half-saturation (mg/l) | 0.001 |
| Nitrogen half-saturation (mg/l) | 0.01 |
| Maximum basal metabolism rate (1/day) | 0.15 |
| Respiration oxygen-to-carbon ratio | 2.67 |
| Oxygen half-saturation constant for DOC excretion (gO2/m3) | 0.5 |
| Reference temperature for basal metabolism (°C) | 20 |
| Effect of temperature on basal metabolism (1/°C) | 0.069 |
| Effect of temperature on predation (1/°C) | 0.069 |
| Death rate (1/day) | 0.02 |
Table 2: Green algae parameters
Results and Discussion
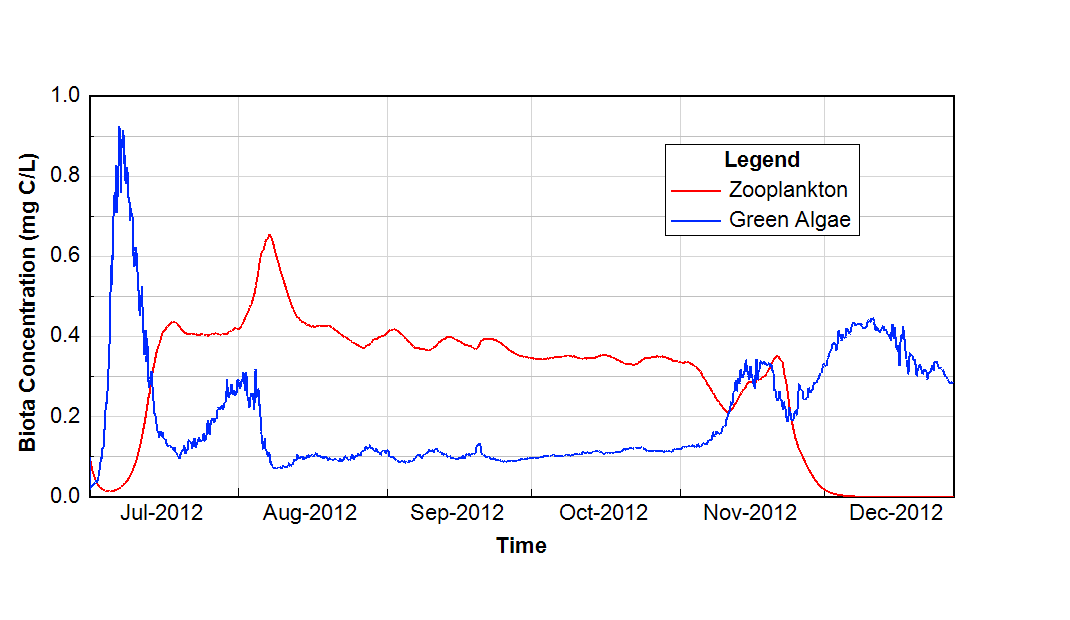
The temporal change in biota concentration (in mg of C/L) in a representative cell in the lake is shown Figure 2. As the summer starts, the green algae population increases. The growth in the green algae population provides an increase in food availability for zooplankton, causing an increase in its population. We can observe similar behavior in the biota population at the start of August when green algae entered the domain through the inflow tributary.

This initial growth was followed by a long period of equilibrium between biota species. From the end of November, the lake temperature started decreasing. Because this condition is not favorable for zooplankton growth, we observe a decrease in zooplankton concentration. As the lake temperature continued to decrease, the growth could not compensate for basal metabolism, predation, or death. Zooplankton concentration reaches near zero during this period.
Animations illustrating the temporal change in temperature (left), zooplankton concentration (middle), and green algae concentration (right) in Lake Thonotosassa
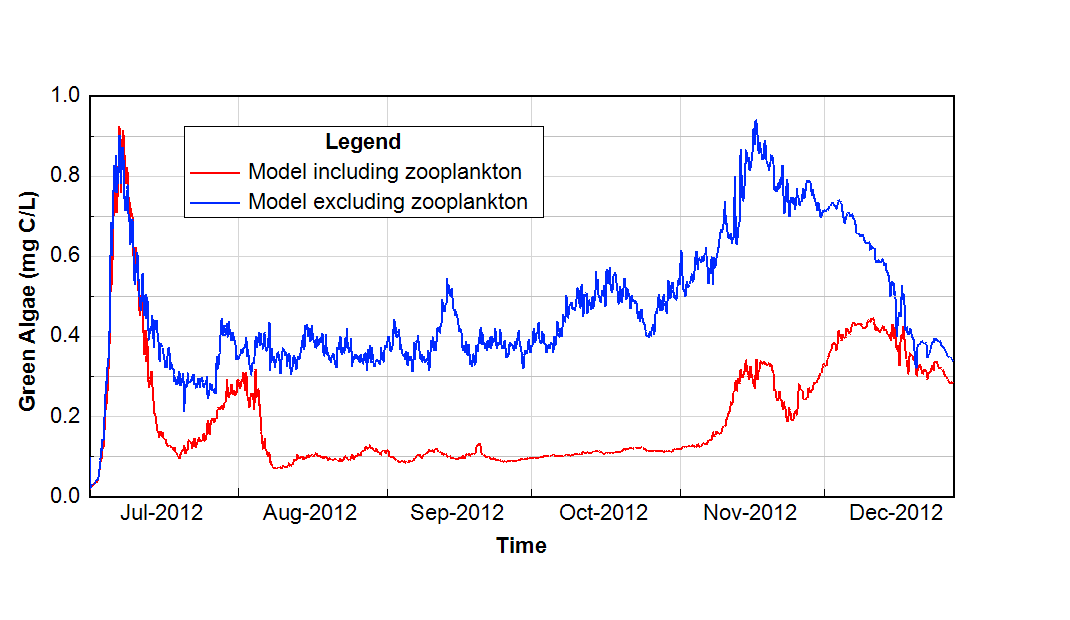
Figure 3 compares the temporal change of green algae concentration in the lake by running two models, one with and one without zooplankton. The effect of zooplankton on algae is highlighted in this figure with a relatively high green algae concentration (blue). With the presence of zooplankton, the algae concentration (red) was reduced as it was consumed by zooplankton.

Conclusion
In this blog, we have shown how we performed initial modeling of the zooplankton population in Lake Thonotosassa. The results showed that EEMS10.3 was able to capture zooplankton kinetics. These results demonstrate a way forward for water quality modelers to improve the accuracy of their computation of algal biomass by including zooplankton in their simulations.
Further tests will go into detail on the interaction between zooplankton and phytoplankton, as well as other nutrient components. Additionally, for the validation, the new zooplankton model implemented will be tested for real application in collaboration with professor Dongil Seo from Chungnam National University, South Korea.
Do you want to give this model a try? Download the example model and demo version of EEMS today. Feel free share your results and ask questions in our forums.


