In recent decades, loss of life from natural disasters has dropped considerably as we have become better prepared with respect to warnings and emergency preparedness. It is vital, however, to continue to reduce the impacts of hurricanes and severe storms on society in terms of fatalities and infrastructure damage. Studies indicate that up to 90% of deaths due to hurricanes are water-related, with flooding and storm surge the predominant cause of loss of life and destruction. Approximately half of all fatalities are a result of storm surge (Rappaport, 2014). This means that a critical component of reducing hurricane-related impacts is developing accurate simulations of the approaching weather system and understanding how the system will impact infrastructure. Hurricane modeling has improved markedly in recent decades, allowing increasingly realistic simulations of the hydrologic and hydrodynamic impacts of severe storms and hurricanes. For this purpose, EEMS has been enhanced with a tropical cyclone module; as an example, this has been applied to Lake Okeechobee for Hurricane Irene, which struck Florida in 1999. Hurricane Irene took eight lives and caused an estimated $800 million in damage.
Model Description
When Zhen-Gang Ji developed his Lake Okeechobee Environmental Model (LOEM) in the early 2000s, it was one of the most comprehensive EFDC model applications. It relied on a comprehensive data set for model setup, external loadings, and model calibration, verification, and validation (Ji, 2008).
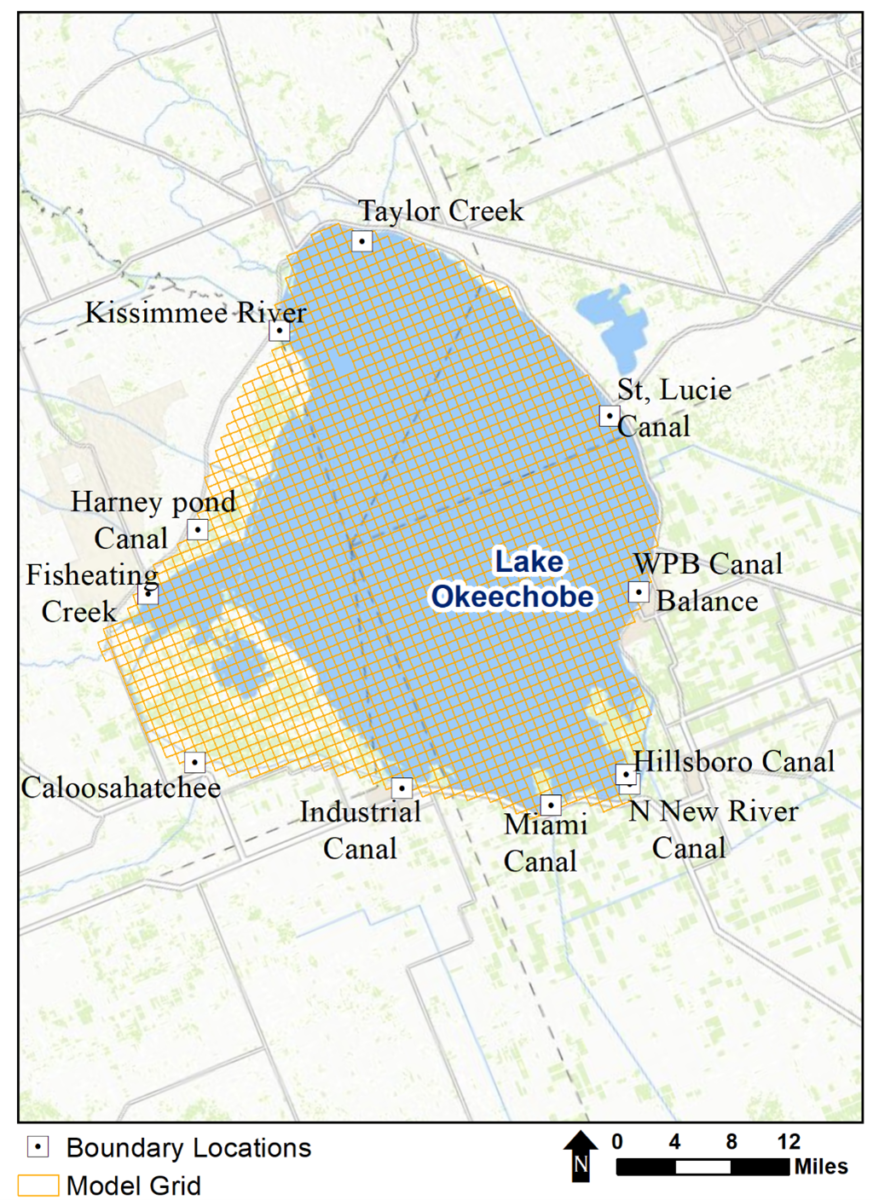
DSI has modified this model for our EFDC+ simulation of Hurricane Irene. The model domain covers an area of 1781.34 km2 and uses a regular Cartesian grid comprising 2121 cells, with dimensions of 910 x 920 m. In the vertical dimension, the model uses Sigma stretch layering with 5 layers.

For our EFDC+ simulation of Lake Okeechobee, we used historical data for the Hurricane Irene storm track from NOAA’s National Hurricane Center and Central Pacific Hurricane Center. The Center provides a comprehensive Atlantic hurricane database (HURDAT2) extending from 1851 to 2020. Furthermore, the Center also offers storm predictions; since its first 24-hour storm track predictions in 1954, forecasts have expanded in time and now include estimates of intensity, size, and associated hazards, such as wind, storm surge, and rainfall.
Lake Okeechobee Characteristics
Lake Okeechobee, situated in central Florida, is the second-largest freshwater lake wholly within the United States. The lake is approximately 40 miles (65 km) northwest of West Palm Beach and lies at the northern edge of the Everglades. Okeechobee is a Seminole Indian name for “big water” and is regarded as the liquid heart of Florida.
The lake is approximately 35 miles (55 km) long and has a shoreline of 135 miles (220 km). It covers an area of approximately 730 square miles (1,900 square km), which includes several small islands. The surface is 12.5 to 15.5 feet (4 to 5 m) above mean sea level, depending upon the water level in the lake, and the average depth is 10 to 12 feet (3 to 4 m) (Britannica, 2020). The most significant inflow into the lake is the Kissimmee River watershed, directly to the north of the lake. This watershed drains into a series of lakes, which in turn empty into the Kissimmee River as it flows southward to Lake Okeechobee (Britannica, 2020)
In the 1920s, hurricanes destroyed the dike system on the lake’s southern edge, resulting in thousands of deaths. In 1937, the Army Corps of Engineers (USACE) built the Okeechobee Waterway, a network of canals and floodgates that includes a series of five locks that help boats along the 152-mile stretch of waterway. The lake is now encompassed by a flood protection system that was primarily completed in the 1960s. The USACE and the Southwest Florida Water Management District manage the lake using these dikes and waterways. These allow protection against flooding, prevent salinity intrusion, and provide water for irrigation and drinking water (Ji, 2017).
As with most large shallow lakes, circulation patterns in the lake are primarily influenced by the wind. Other factors such as temperature, inflows, outflows, and Coriolis force play a much smaller role (Ji, 2017).
Cyclone Module Configuration
Before the tropical cyclone module was activated in EEMS10.4, we first calibrated a “without cyclone” model for water levels. The tropical cyclone module was then turned on and configured as a “with cyclone” model. The following are the basic steps do do this:
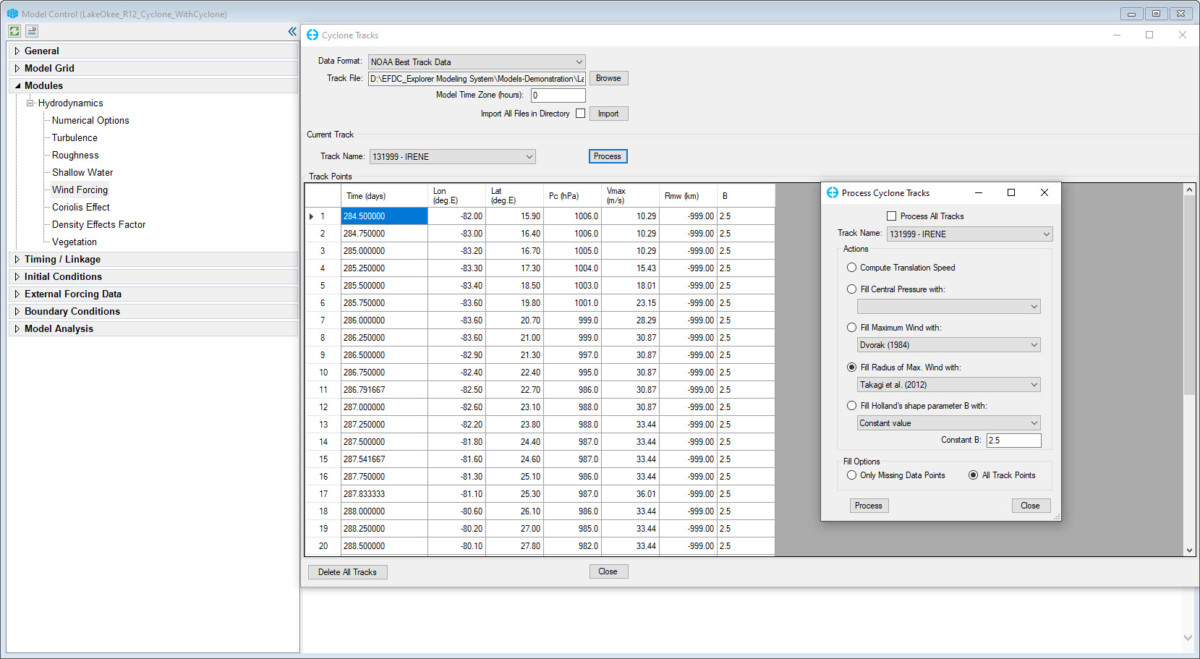
- In the EEMS Model Control form, select the Modules menu item. Then from within the Hydrodynamics module, Right Mouse Click (RMC) on Wind Forcing .
- Select the computational options for the tropical cyclone. This simulation uses the default Holland (1980) option. Click the Edit button, and the tropical cyclone module will appear.
- Click the Import button and browse to track file Hurricane Irene (1999).txt, which was slightly pre-processed after extraction from the database. Click the Import
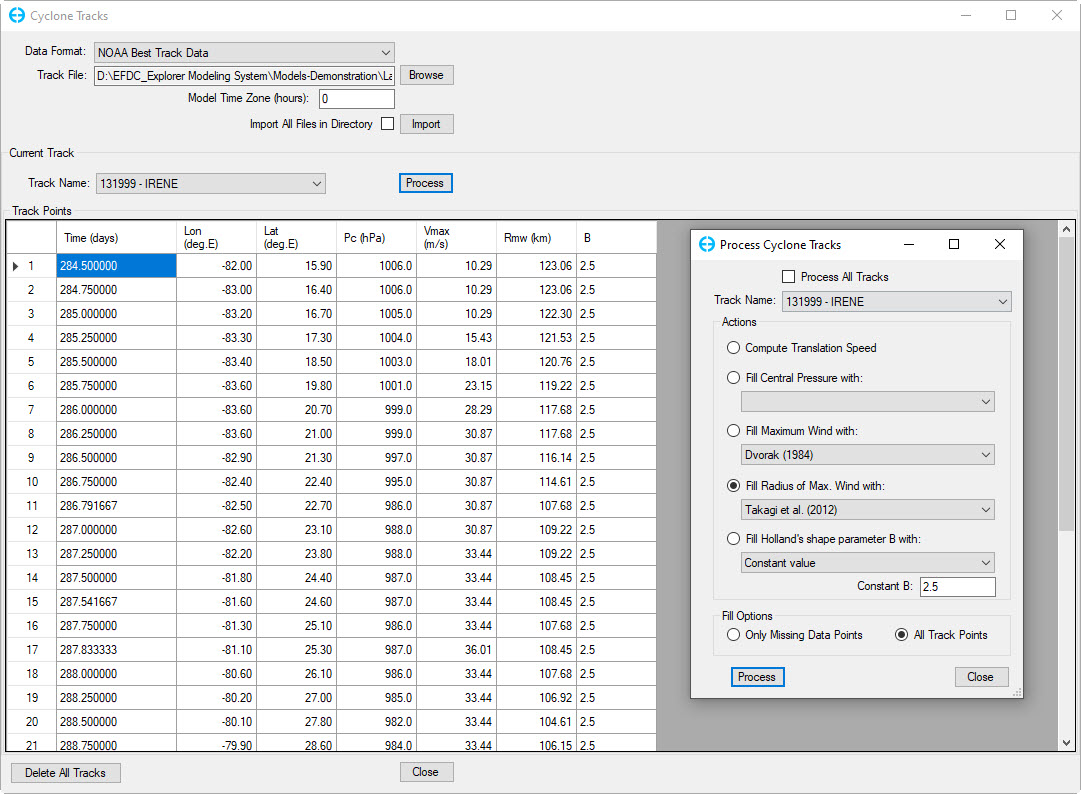
- Sometimes there will be -999 values for parameters such as the Rmw (radius of maximum wind) column, as shown Figure 2. In that case, select the Process button and check the fill Radius of Max. Wind box and select a formula from the drop-down list. Choose fill for Only Missing Data Points or All Track Points in the Fill Option frame, select the Process button, and save the model


Results
The animation shown in Figure 4 shows the velocity field in the lake with the passing of the hurricane. The left-hand panel shows the lake with the tropical cyclone module configured for Hurricane Irene. The middle panel shows the path of the hurricane and the movement at each time step. The right-hand panel shows the lake without the impact of the cyclone module. As observed in the simulation, the model captures the effects of the wind field, which impacts the water levels in the lake and related storm surge. The changing water levels can be seen via the color ramp in Figure 5, where the left-hand panel depicts the significant changes in the water surface elevation caused by the hurricane. This kind of simulation can be coupled to either a hydrologic model or an expanded EFDC+ grid to determine flooding impacts and support infrastructure planning and management decisions.
Such a finding demonstrates the significance of bathymetry in the impact of storm surge and, therefore, the importance of bathymetry in hydrodynamic simulations of water bodies. Using this information can help develop models that combine the effects of sea-level rise, landscape changes, and coastal flooding to determine the vulnerability of highway bridges and other critical infrastructure (Anarde, 2018).
Final Thoughts
The tropical cyclone module will be available in the beta release in the coming weeks. The Lake Okeechobee model can be loaded and run in the EEMS10.4 Beta version, even in the free demo model. Contact us if you are interested in trying this feature.
Want to give it a try? You can start by downloading our Free Demo and demonstration models. To see these features in action, head over to our YouTube page.
References
Anarde, Katherine et al. Impacts of Hurricane Storm Surge on Infrastructure Vulnerability for an Evolving Coastal Landscape. Natural Hazards Review 19(1), February 2018. DOI: 10.1061/(ASCE)NH.1527-6996.0000265
Britannica, T. Editors of Encyclopaedia. “Lake Okeechobee.” Encyclopedia Britannica, January 17, 2020. https://www.britannica.com/place/Lake-Okeechobee.
Ji, Zhen-Gang. 2017. Hydrodynamics and Water Quality: Modeling Rivers, Lakes, and Estuaries, 2nd ed. John Wiley & Sons, Inc., Hoboken, NJ (USA).
Rappaport, Edward N. Fatalities in the United States from Atlantic Tropical Cyclones: New Data and Interpretation. Bulletin of the American Meteorological Society, Volume 95: Issue 3, Mar 2014, DOI: https://doi.org/10.1175/BAMS-D-12-00074.1
Klotzbach , Philip J. Bowen, Steven G., Pielke Jr., Roger, Bell, Michael. Continental U.S. Hurricane Landfall Frequency and Associated Damage: Observations and Future Risks. Bulletin of the American Meteorological Society, Volume 99: Issue 7. 1 Jul 2018. https://doi.org/10.1175/BAMS-D-17-0184.1


