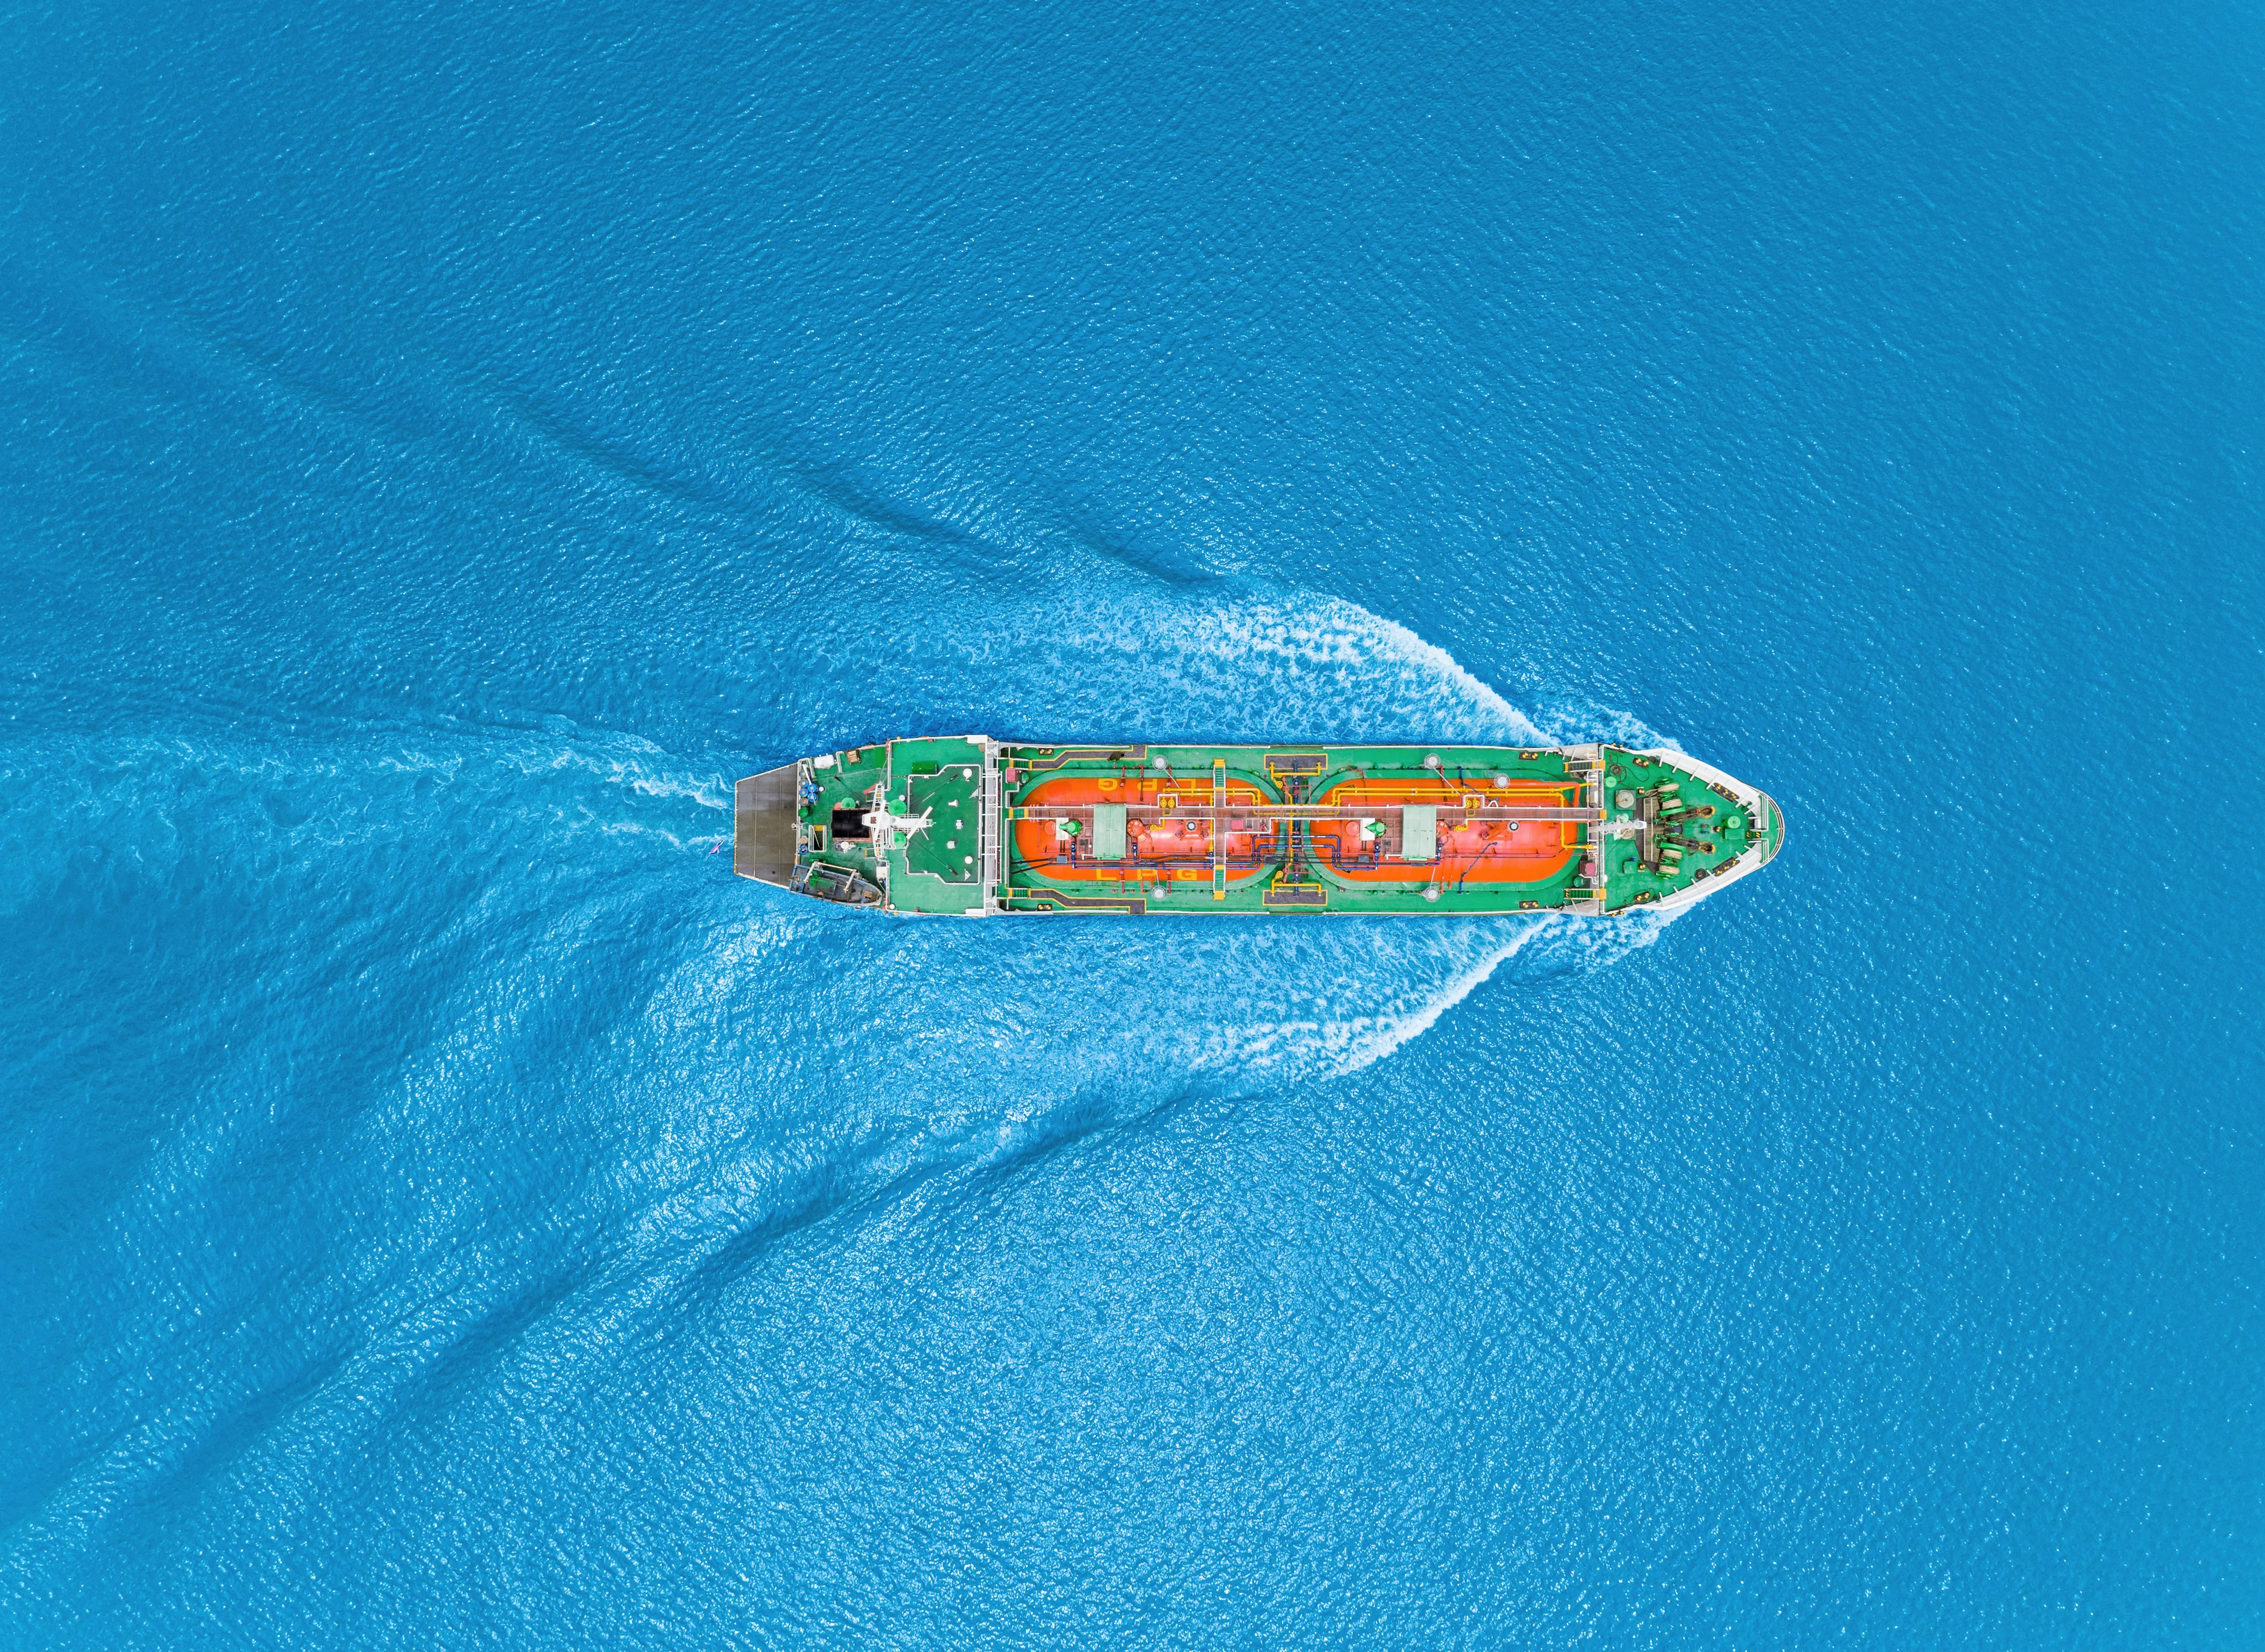
Sediment erosion caused by propeller wash from ships is of considerable concern in many ports and harbors for terminal safety. Using the newly developed propwash features available in EEMS10.3, DSI engineers modeled the impacts of propeller wash on a ferry terminal in Kingston, WA.
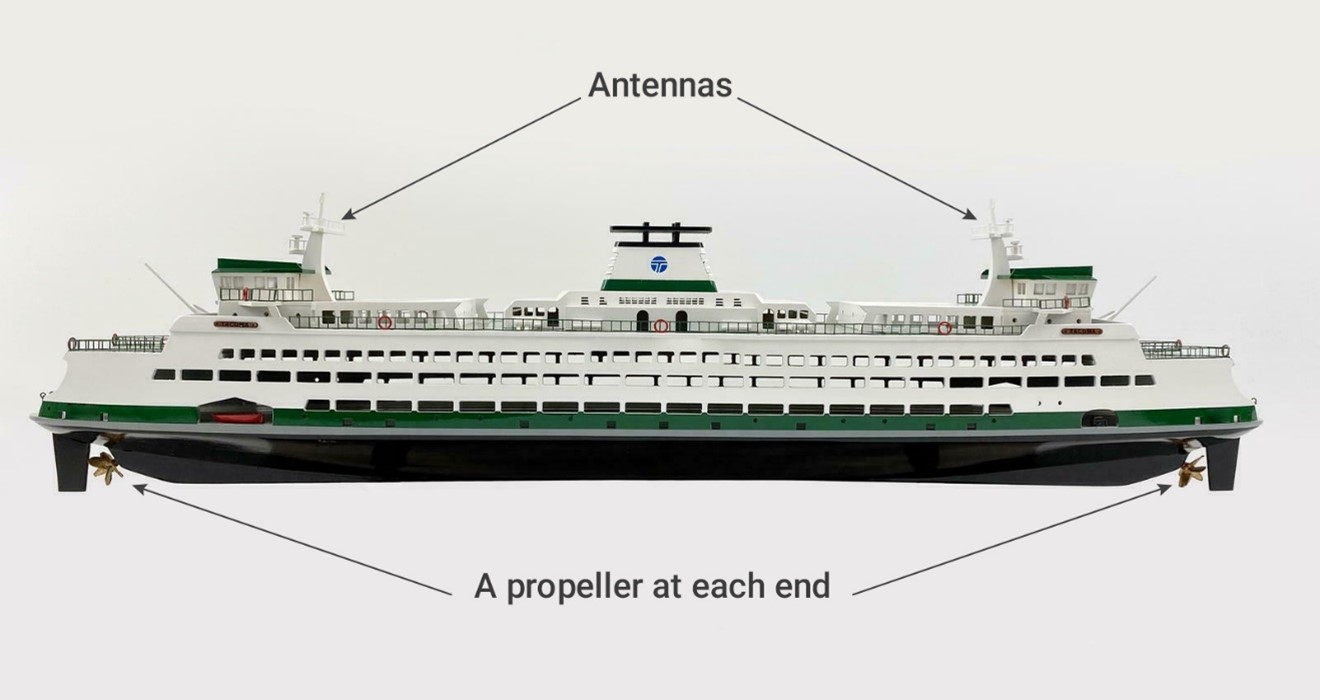
The Edmonds – Kingston ferry route across Puget Sound is part of the Washington State Ferry System, which currently is the most extensive ferry transport system globally, with 21 vessels carrying 66,000 passengers and 29,000 vehicles every day. There are 46 ferry trips between Edmonds and Kingston every day and 322 trips every week. Table 1 presents three different active vessels in this route, with maximum horsepower varying from 11,500 to 16,000. All these vessels are double-ended (Figure 1), with symmetric propulsion systems and boarding ramps on each end, allowing the ship to arrive and depart at the terminal without changing orientation.
| Ship Name | M/V Puyallup | M/V Spokane | M/V Walla Walla | |
|---|---|---|---|---|
| Info[1] | MMSI | 366759130 | 366709780 | 366710810 |
| Class | Jumbo Mark II | Jumbo | Jumbo | |
| Size | Length (m) | 140 | 134 | 134 |
| Beam (m) | 28 | 26 | 26 | |
| Draft (m) | 5.6 | 5.5 | 5.5 | |
| Engine | Speed in Knots | 18 | 18 | 18 |
| # of Engines | 4 | 4 | 4 | |
| Horsepower | 16,000 | 11,500 | 11,500 | |
| RPM Max | 210 | 180 | 180 | |
| Propeller[2][3] | Diameter (m) | 3.962 | 3.962 | 3.962 |
| # Blades | 5 | 4 | 4 | |
| # Blades Area Ratio | 0.75 | 0.6 | 0.6 | |
| Pitch Ratio | 0.959 | 1.05 | 1.05 |
Table 1 Specifications Of Vessels On Edmonds-Kingston Ferry Route
Model Development
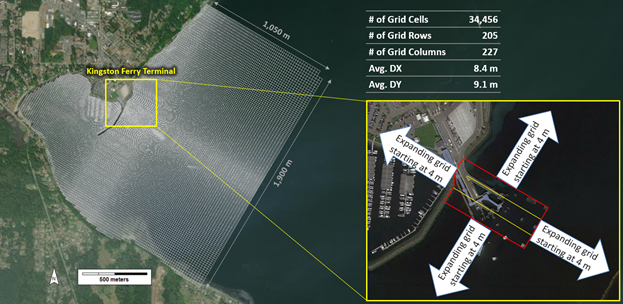
Using publicly available bathymetry data (Finlayson, 2005), DSI developed a 3D hydrodynamic model of the terminal. Figure 2 displays the model domain that covers about 2.6 km^(2) with approximately 35 thousand telescoping grid cells, with the grid density decreasing from the terminal to the outside extents.
Vessel data for arrivals and departures for the Kingston ferry terminal were obtained from AIS data. AIS is the Automatic Identification System that uses transceivers on ships and is used by vessel traffic services. This data was collected by Kastner et al. (2019), who conducted a case study to investigate the causes of severe erosion at the Kingston Ferry Terminal.
The Kingston Ferry Terminal has three slips; a slip is a specialized docking facility that receives a ferryboat. Figure 3 shows the AIS vessel tracking on March 18, 2018, and it can be seen that a majority of the ferry traffic on that specific day is in Slip 1.
A period was selected when all three ferries were operating the route and then narrowed down from 06:00 to 24:00 on March 18, 2018. On that particular day, MV Walla Walla was the ship that was traveling the route. The AIS vessel track data, ferry dimensions, engine power, and propeller properties information were configured in the EFDC+ model using EFDC+ Explorer to simulate the propeller wash effects at the terminal.
Figure 3. AIS Vessel Tracking of MV Puyallup, MV Spokane, and MV Walla Walla on March 18, 2018.
To help determine how well EFDC+ simulated this system, we compared 3D water velocity data from two Acoustic Doppler Velocimeters (ADVs). Kastner et al. (2019) installed the ADVs at fixed depths in the north piling and south piling of Kingston Terminal Slips 1 and 2, and they collected the near-bed velocity data over the period March and April 2018.
Results
The model was used to predict the depth-averaged ambient flow velocity, sub-grid flow velocity at the seabed, and sub-grid shear stress at seabed caused by propeller wash. Figure 4 shows the impact of propeller momentum on the 3D velocity field in EFDC hydrodynamics, which presents the velocity jet back behind the ship.
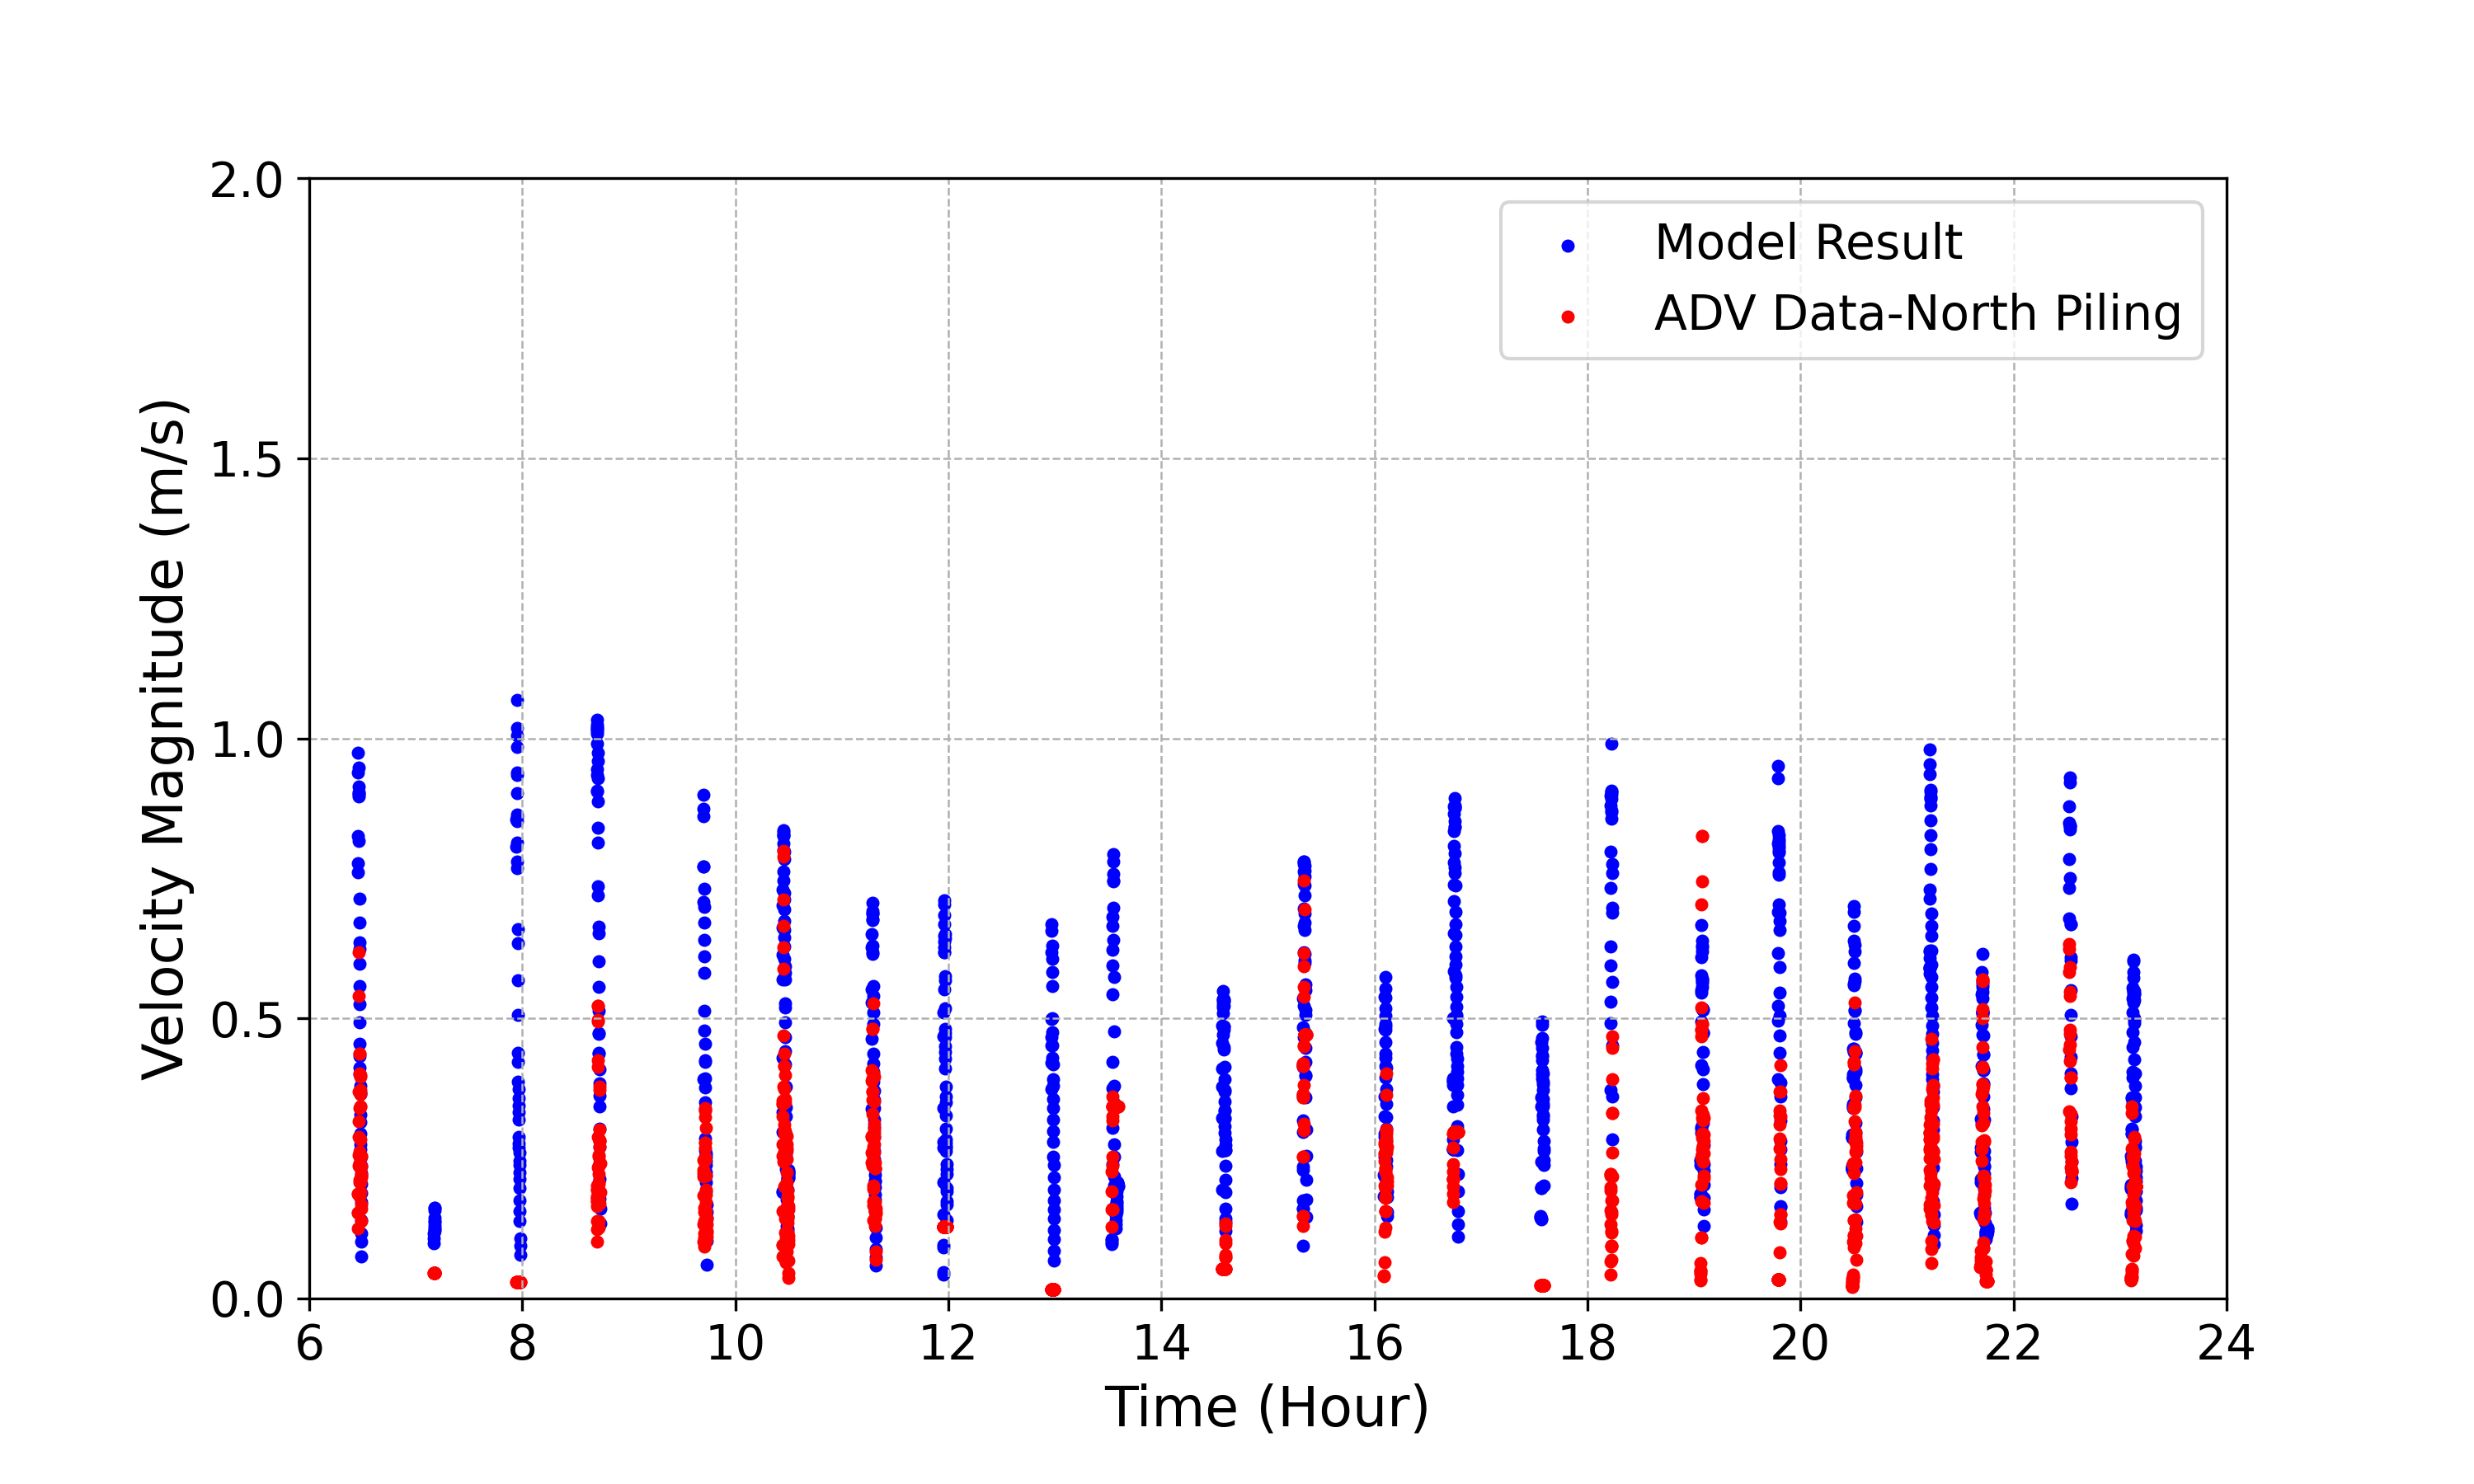
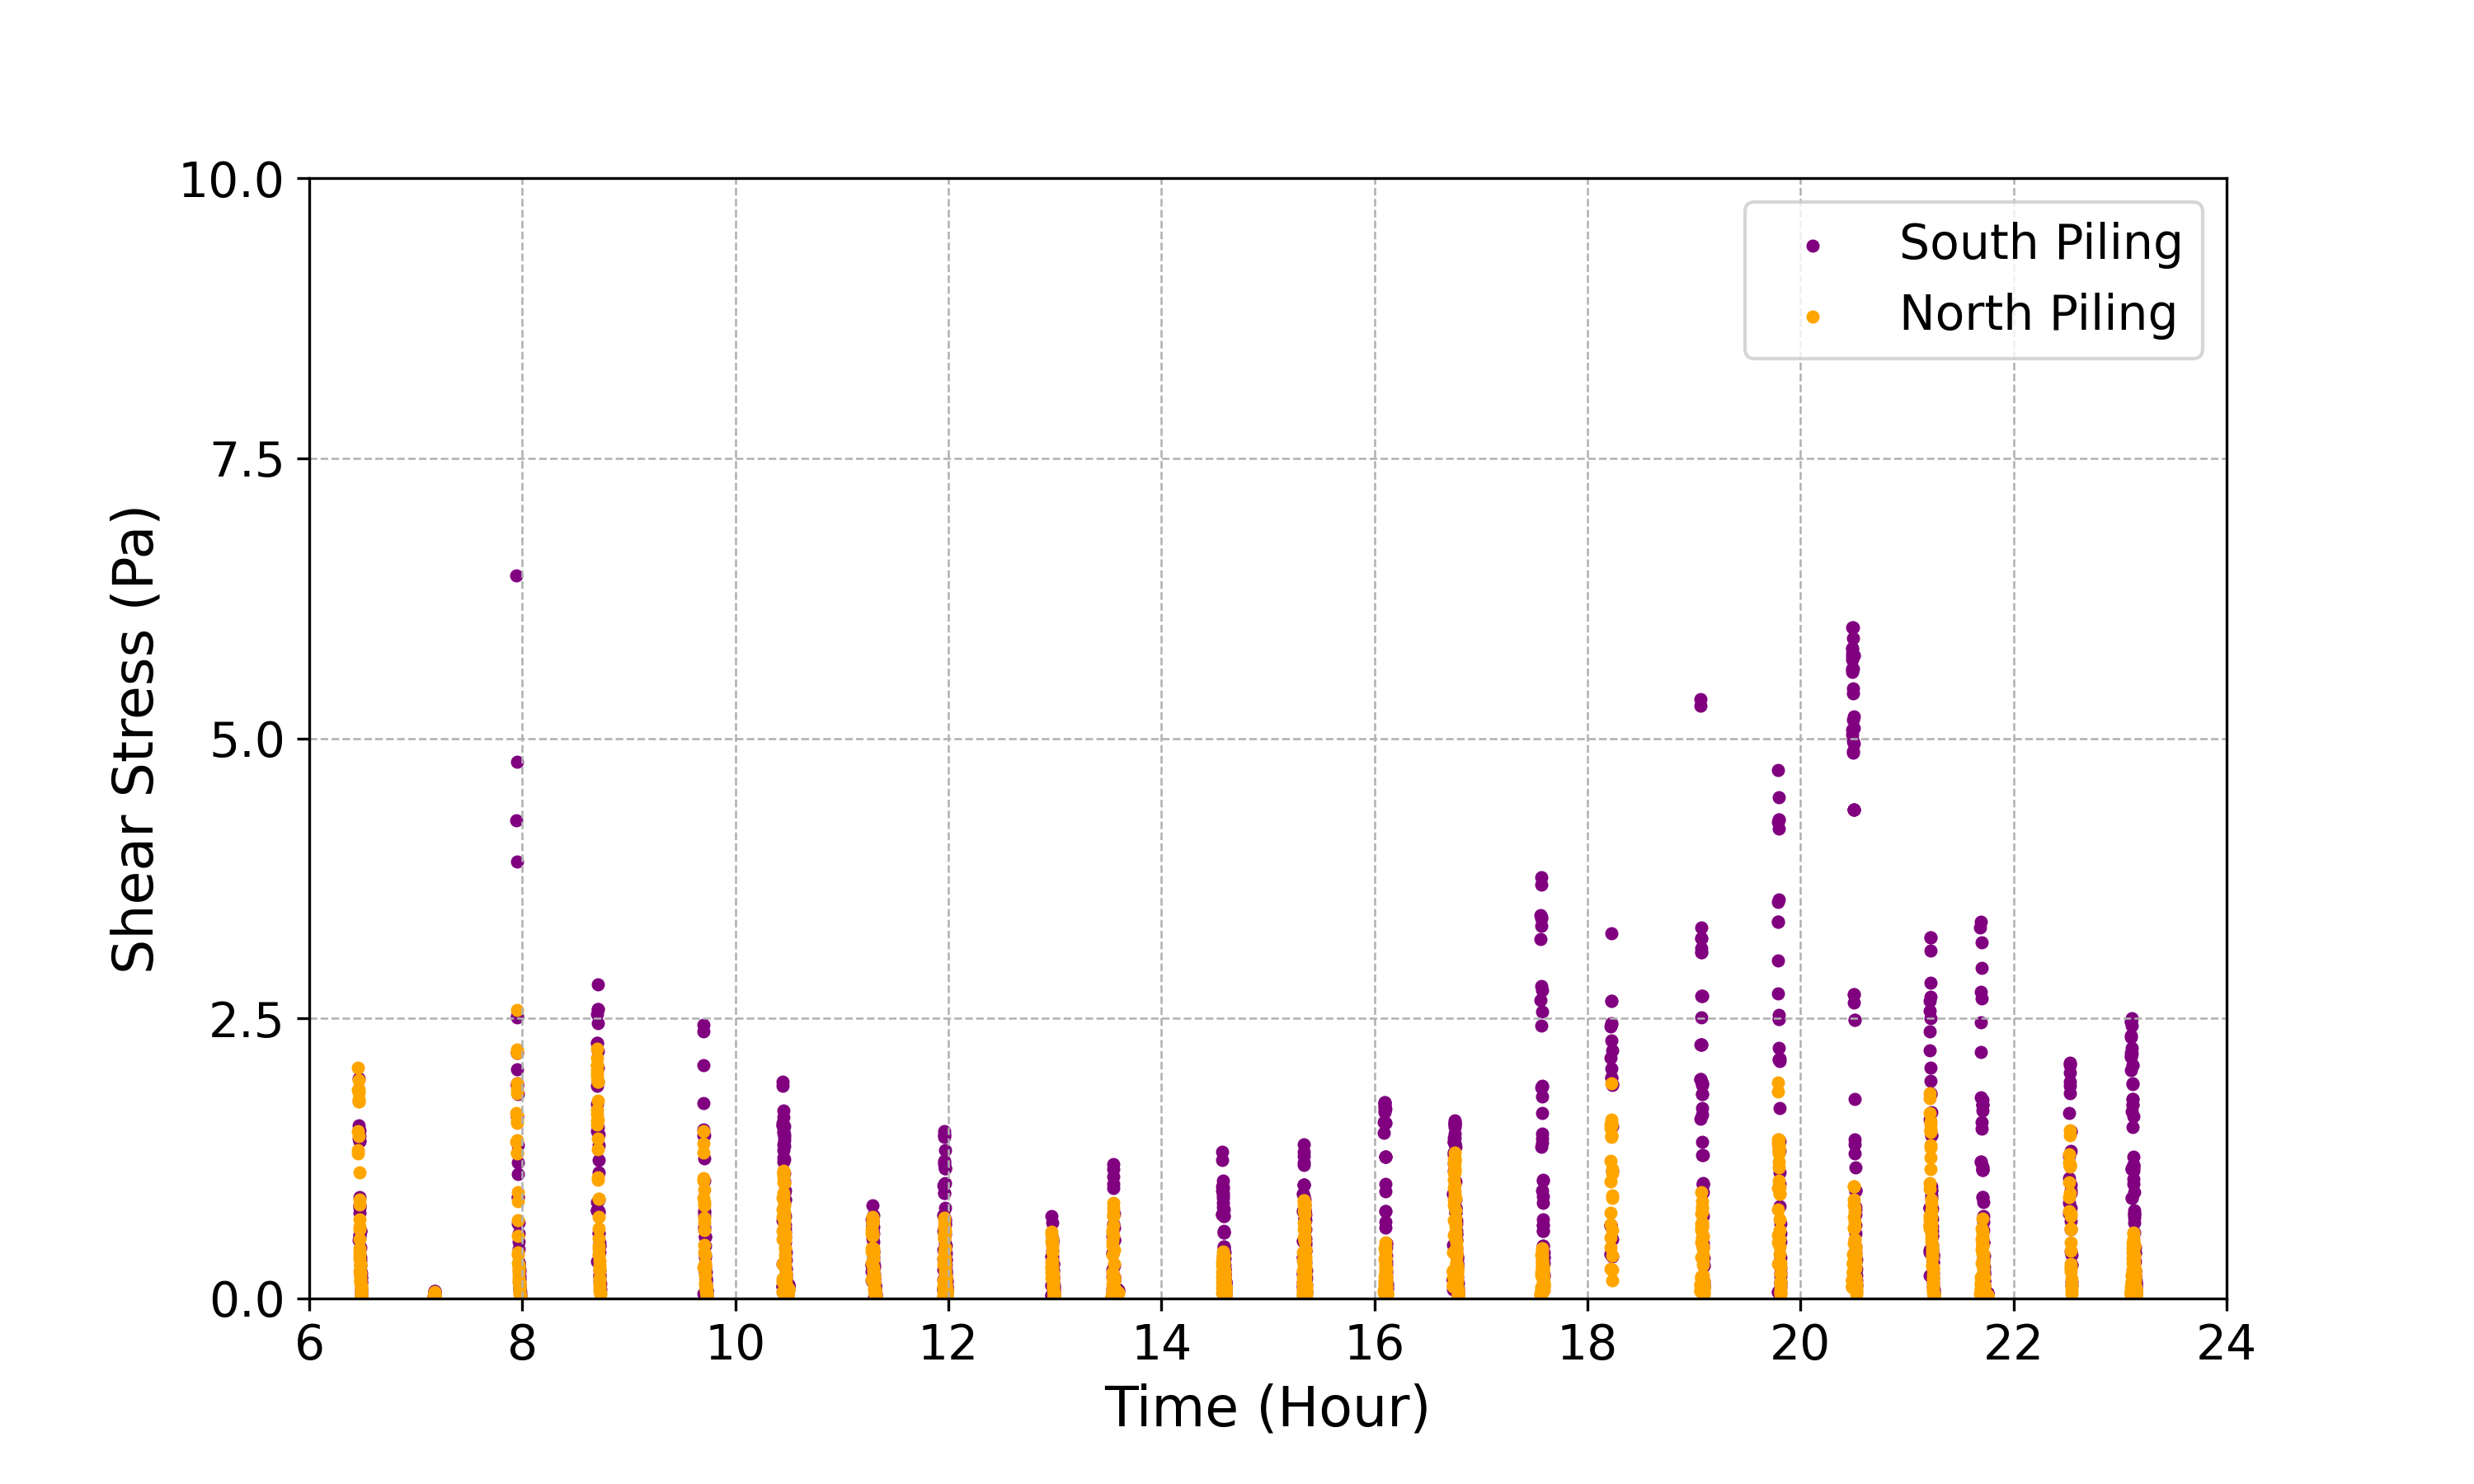
When compared to ADV-observed velocity spikes due to ferry departures, the model reasonably reproduces these results (Figure 5). Figure 5 shows measured ADV six-second low-pass filtered data as red dots compared to the predicted velocity magnitude as blue dots at the north piling of Terminal 1. In general, there is a strong correspondence in the timing of the velocity peaks between the data and model results. The variation in magnitude might be due to the AIS data precision (vessel position) or wind conditions that are not included in this model. Figure 6 shows the simulated shear stress caused by propeller wash at the seabed at the north and south pilings. The modeled bed shear stress exceeded 6 Pa at the south piling. This is a very high value and is expected to cause severe scour even in a gravel bed.
Conclusions
The modeling study for the Kingston Ferry Terminal demonstrates the functionality and capabilities of the EEMS propwash tool. The model reasonably reproduced the ADV-observed velocity spikes due to the ferry departure. The model predicted bed stress in exceedance of 6 Pa at the south piling, which can cause severe scour in a gravel bed. Likewise, as presented in this study, the EEMS propeller wash modeling can be an effective tool for managing and mitigating ship scour issues.
Download EEMS today and give it a test drive in the demo mode using multiple test and demonstration models available on our website.
EWRI 2021 Congress Propwash Presentation using Kingston Ferry
DSI Senior Consultant, Paul Craig, made a presentation at the World Environment & Water Resources Conference on June 11. Mr. Craig spoke about the “Application of a Dynamically Coupled Near/Far Field Propeller Wash Scour Sediment Transport Model to Estimate Scour Around a Berthing Facility.” The application was for this Kingston Ferry case-study. The presentation explains the theory behind this module, showing that while several approaches have been developed to compute the effect of propwash linked to a numerical sediment transport model, these approaches have limitations that usually prevent full dynamic coupling. In this presentation, the development of a propwash model dynamically linked to the widely used open-source EFDC+ code is outlined. It shows how the model computes shear stresses and scour induced by propwash, including propeller energy on the three-dimensional flow field. The presentation may be viewed here.
References
Finlayson D.P. (2005), Combined bathymetry and topography of the Puget Lowland, Washington State. University of Washington, viewed 05 April 2021.
Kastner et al. (2019) Ferry Vessel Propeller Wash Effects on Scour at the Kingston Ferry Terminal, WA, USA. Washington State Department of Transportation Research Report: WA-RD 899.1.
Kastner, Sam, Thomson, Jim, Horner-Devine, Alex, Stearns, Chris, 2019, Ferry Vessel Propeller Wash Measurements, viewed 05 April 2021.
1 Washington State Department of Transportation: M/V Puyallup, viewed 05 April 2021.
Washington State Department of Transportation: M/V Spokane, viewed 05 April 2021.
Washington State Department of Transportation: M/V Walla Walla, viewed 05 April 2021.
2 Washington State Department of Transportation, Washington State Ferries. Jumbo Mark II Class Vessels, Five -Bladed Propeller, Drawing No. 8110-770-053-01. 2011.
3 Philip F. Spaulding & Associates, Inc. Cross. Sound Ferry for Washington State Highway Commission, Four Bladed Propeller, Drawing No. 7048-53-2. 1971.


