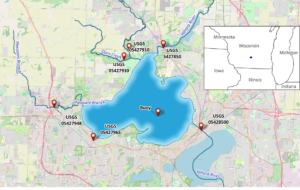


Our previous blog introduced the heat-coupled ice model implemented in EEMS. We also demonstrated its capabilities through a simulation of ice formation and melting in Lake Mendota, located in southern Wisconsin, USA. Since model results can be highly sensitive to input parameters, accurately estimating these parameters for a specific lake can significantly improve ice-thickness predictions. In this blog, we focus on examining the sensitivity of key parameters in the EFDC+ heat-coupled ice model, offering guidance on setting model parameters for more precise simulations of seasonal ice dynamics.
In this study, we build on our work with the Lake Mendota model, focusing on two winter seasons: 2019–2020 and 2020–2021. For detailed information about the model configuration, readers are encouraged to refer to our previous blog. A baseline simulation was conducted using the Heat-Coupled Ice model with default ice parameter values, and the impact of four key parameters on ice duration and thickness was analyzed. The parameters of interest include:
The investigation involved replacing default parameter values with a range of higher or lower values to evaluate their influence on model outcomes. The results of these comparisons are discussed below.
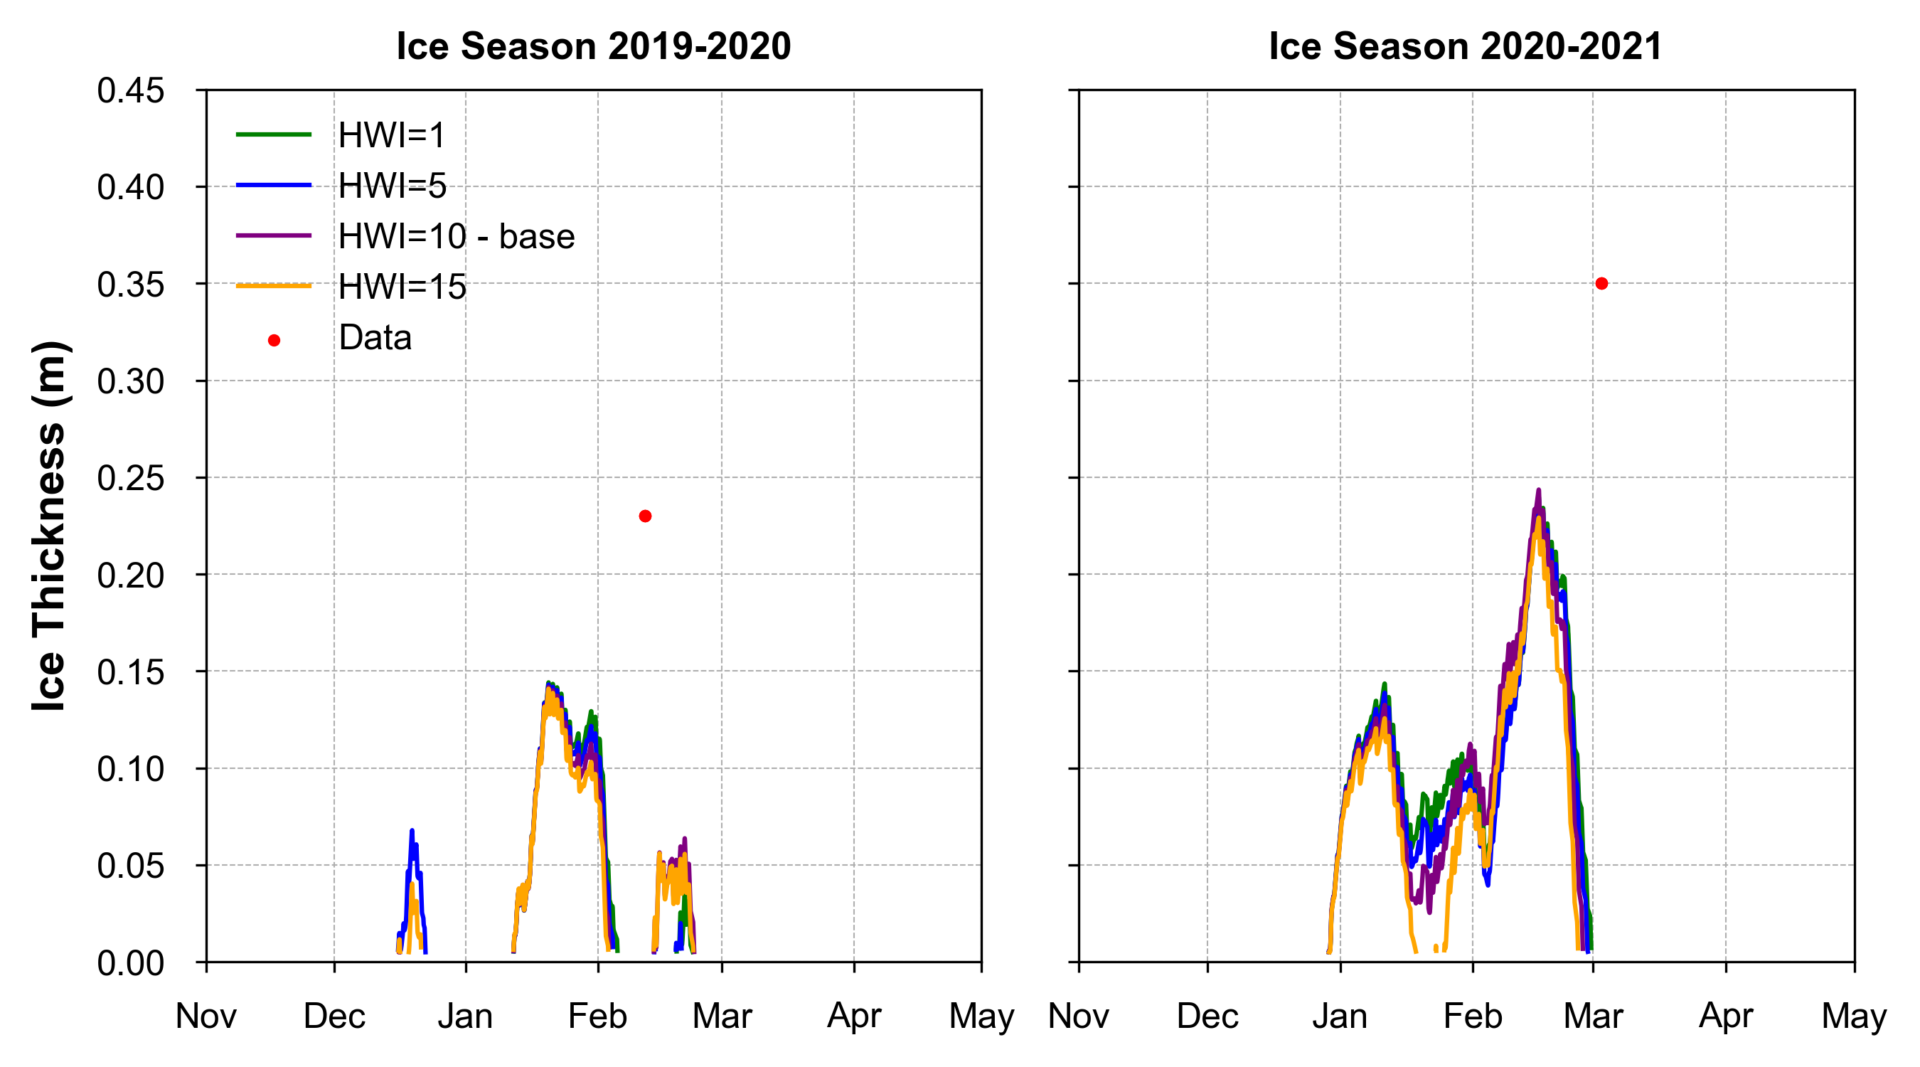
A comparison of ice thickness at the buoy over two seasons (2019-2020 and 2020-2021) with different HWI values (1, 5, 10, and 15) is shown in Figure 2. The red dot represents observed data points. It can be seen that the sensitivity of HWI varies with months. Higher HWI values lead to greater ice thickness as the simulation progresses towards March, with HWI=15 (orange) showing the most significant effect, while lower HWI values correspond with thicker ice during January.
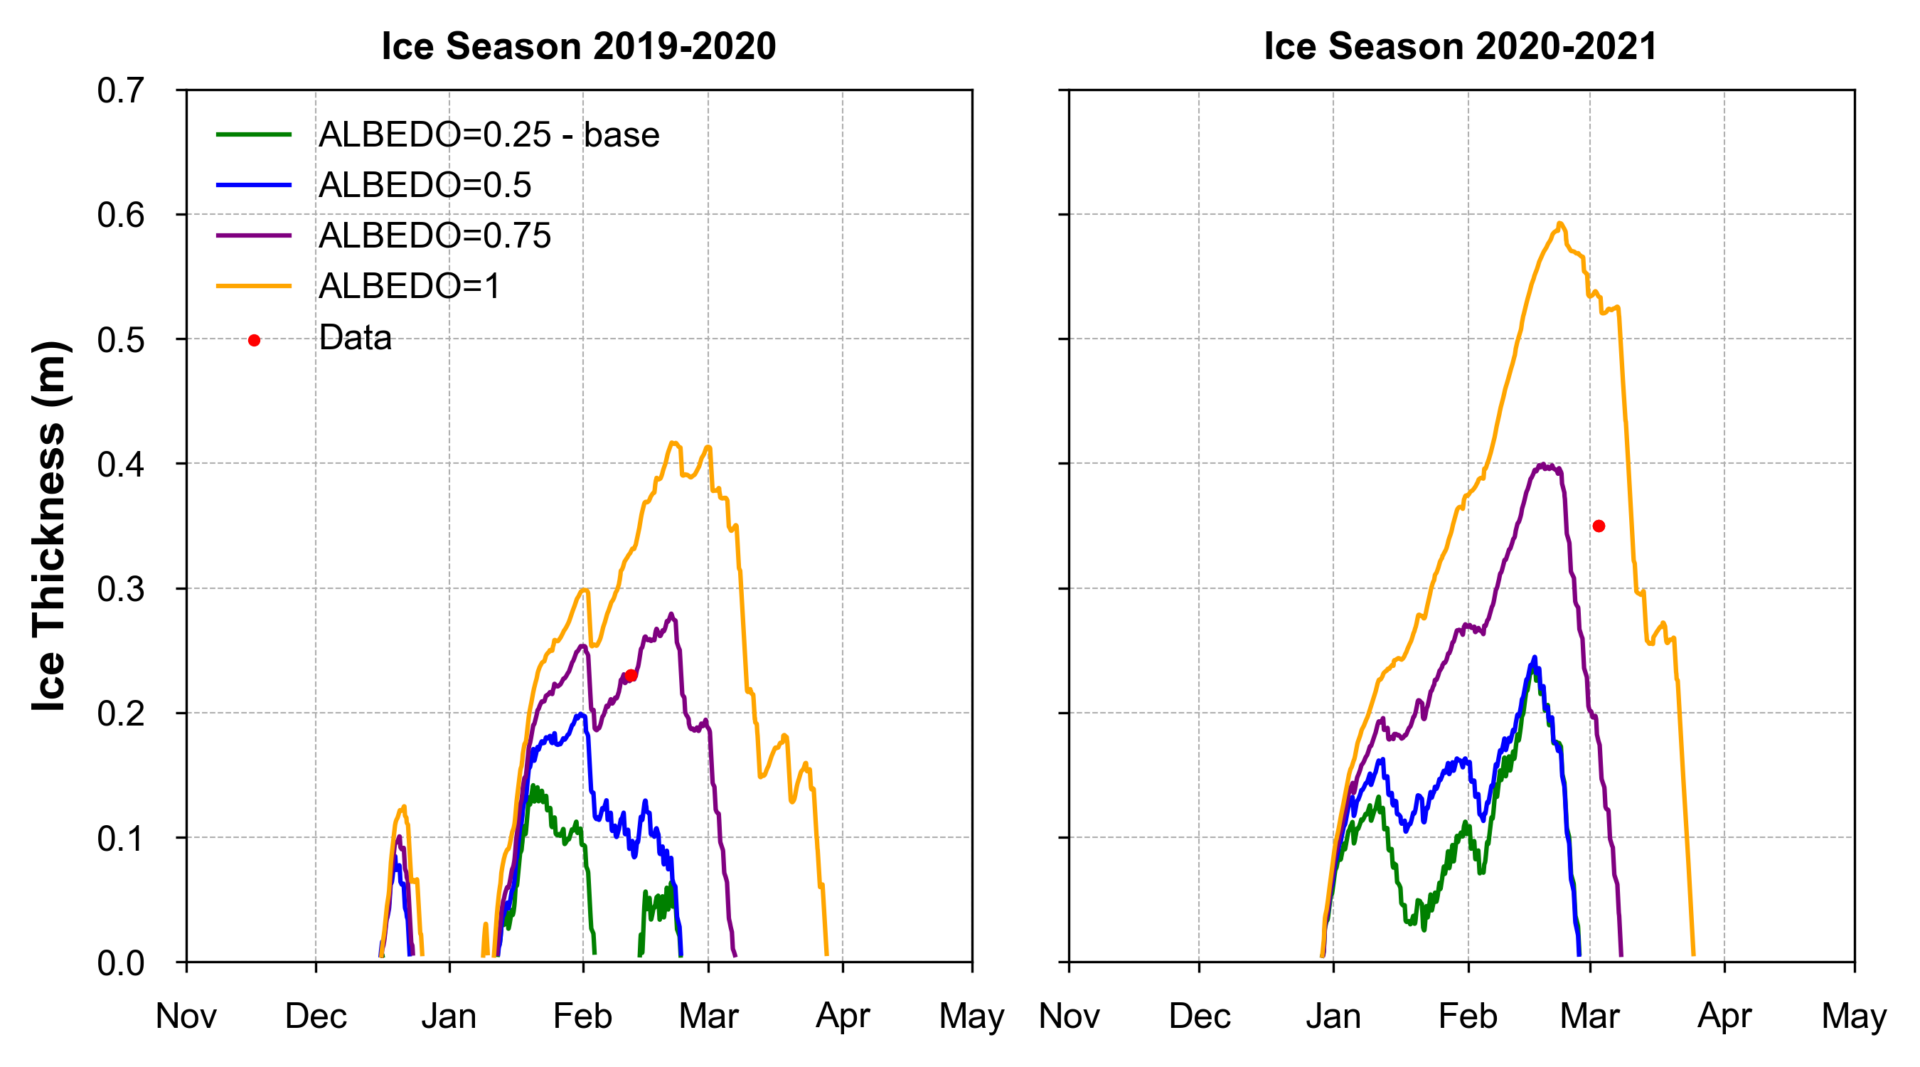
The model results obtained with different albedo values (0.25, 0.5, 0.75, and 1) alongside actual data points are given in Figure 3. Albedo, which measures the reflectivity of the ice surface, significantly impacts ice thickness. For both seasons, higher albedo values generally correspond to greater ice thickness and more extended periods of ice cover, as more sunlight is reflected, reducing melting. The actual data points, however, show some divergence from the modeled predictions, particularly in the 2020-2021 season, indicating that while albedo is a crucial factor, other variables might also play significant roles in determining ice thickness.
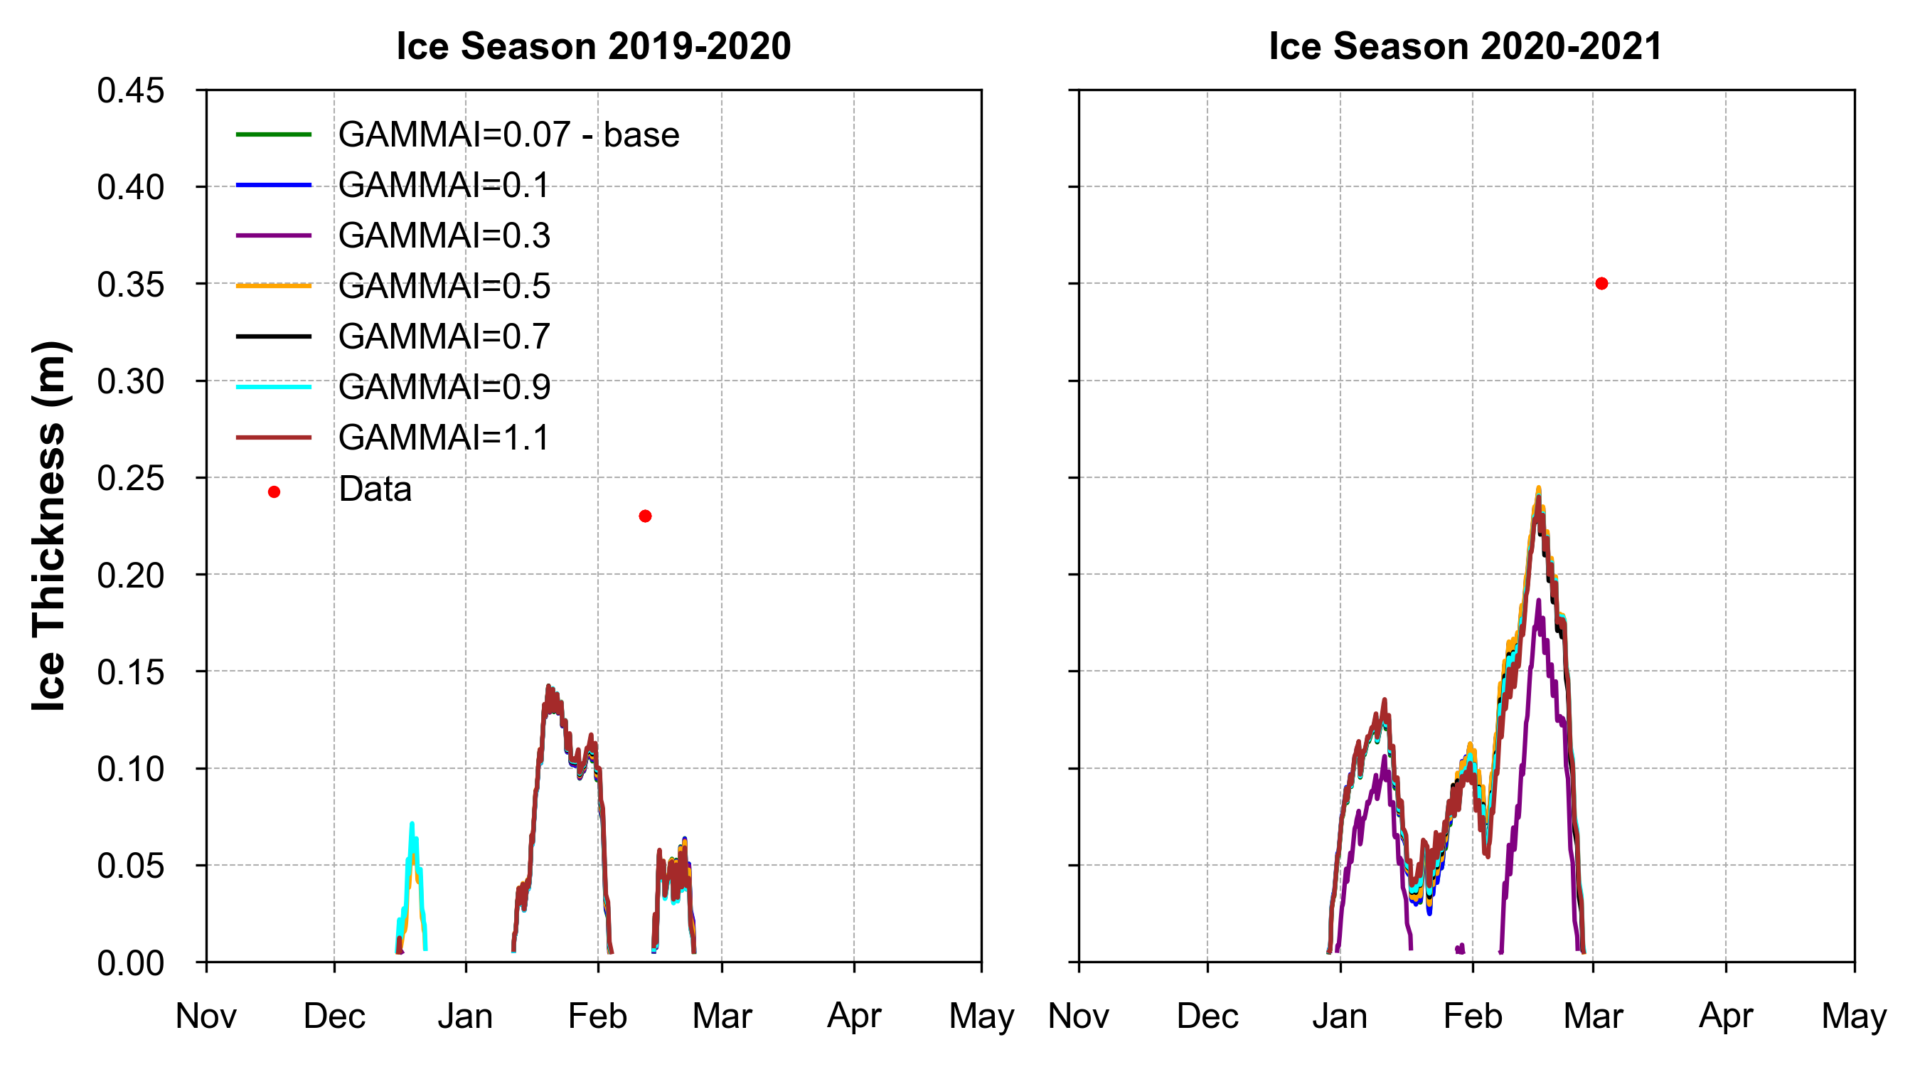
Ice thickness over two seasons (2019-2020 and 2020-2021) with various GAMMAI values ranging from 0.07 to 1.1 is shown in Figure 4. Across both seasons, the differences in ice thickness between GAMMAI values are relatively small, with the black line (GAMMAI=0.7 and GAMMAI=1.1) showing slightly thicker ice than the lower GAMMAI values (e.g., 0.07, 0.1). This indicates that GAMMAI has a more modest influence on ice thickness than the previously tested parameters.
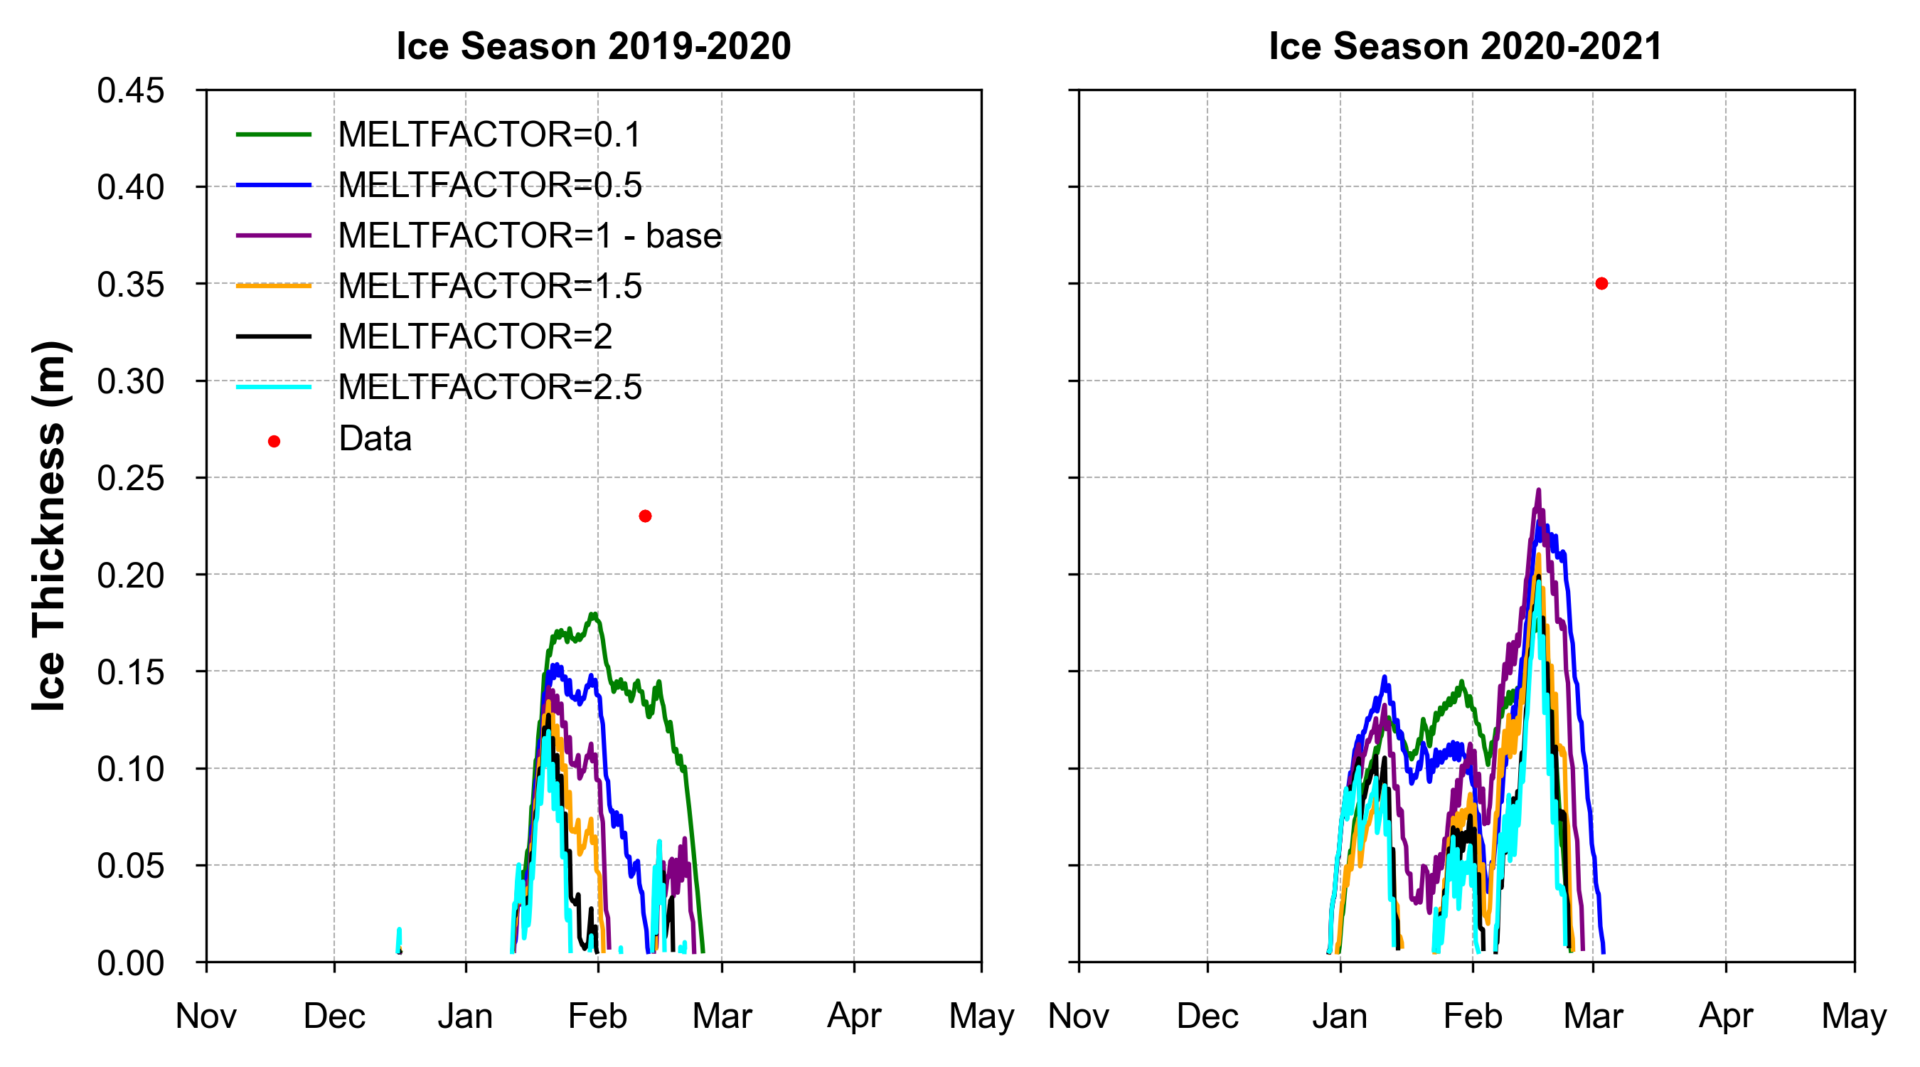
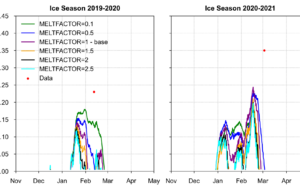
The ice thickness over two seasons (2019-2020 and 2020-2021) under different melt factor scenarios (MELTFACTOR between 0.1 and 2.5) with actual data are shown in Figure 5. For both seasons, MELTFACTOR=0.1 aligns best with observed data. A greater negative melt factor means significantly longer episodes of ice cover and a thicker freezing layer.
This blog highlights the importance of accurate ice modeling in freshwater systems and presents a sensitivity analysis for four ice parameters in EFDC. Out of the four parameters, it is observed that ALBEDO and MELTFACTOR have the most significant effects on ice duration and thickness. Little difference in the model results was seen in varying HWI and GAMMAI.
While this analysis provides valuable guidance for setting model parameters, users should be aware that further testing with other variables is essential, and the model calibration strategy may vary depending on the specific characteristics of the water body being studied. Therefore, it is recommended that additional sensitivity analyses and calibrations be conducted that are tailored to the unique conditions of each modeling scenario.
Do you want to try these options for yourself? You can start by downloading EEMS, activating the free demo mode, and then running our demonstration models. To see these features in action, head over to our YouTube page.
Please get in touch with us if you have any comments or questions. For more information on EFDC+ capabilities, contact the DSI team today.
[simpay id=”6281″]
[simpay id=”6276″]
Your support ticket has been successfully submitted. We will get back to you as soon as we can.


