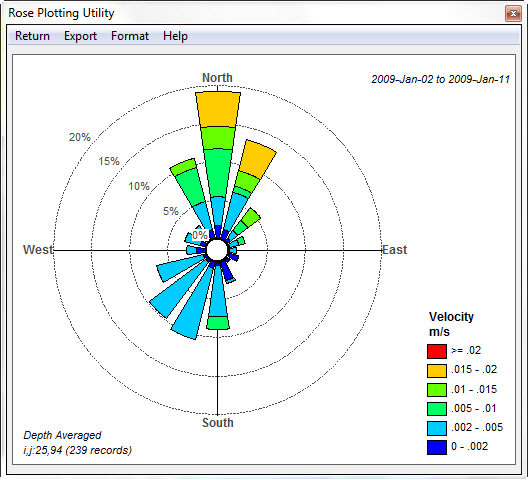
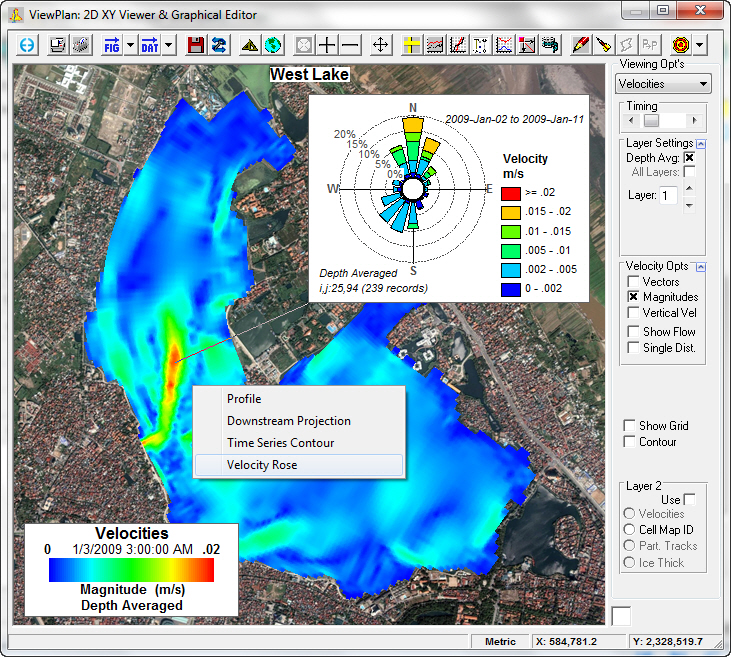
Did you know that EFDC+ Explorer has a Velocity Rose feature? This feature allows the user to view the speed and direction distribution of a given cell over a user defined period of time. To plot the velocity rose the Velocities viewing option should be selected in the ViewPlan. The user can then select the cell of interest with a right mouse click and select the Velocity Rose option. This tool is available for all layers as well as depth averaged, and displays a rose as shown below. The location of the cell being displayed is shown in the bottom left hand corner of the form.

The velocity roses can be attached to the ViewPlan or can be floating as a separated window. Multiple velocity roses may also be displayed.


