Wind is an essential factor in hydrodynamic model settings. EEMS has a feature that allows users to add multiple wind series to the model. Moreover, it provides a flexible station weighting methodology for map files. This feature enables you to place greater weight on stations where the data is more reliable or less impacted by geographic considerations. This blog will show you how to import, configure, and display multiple wind stations in EEMS.
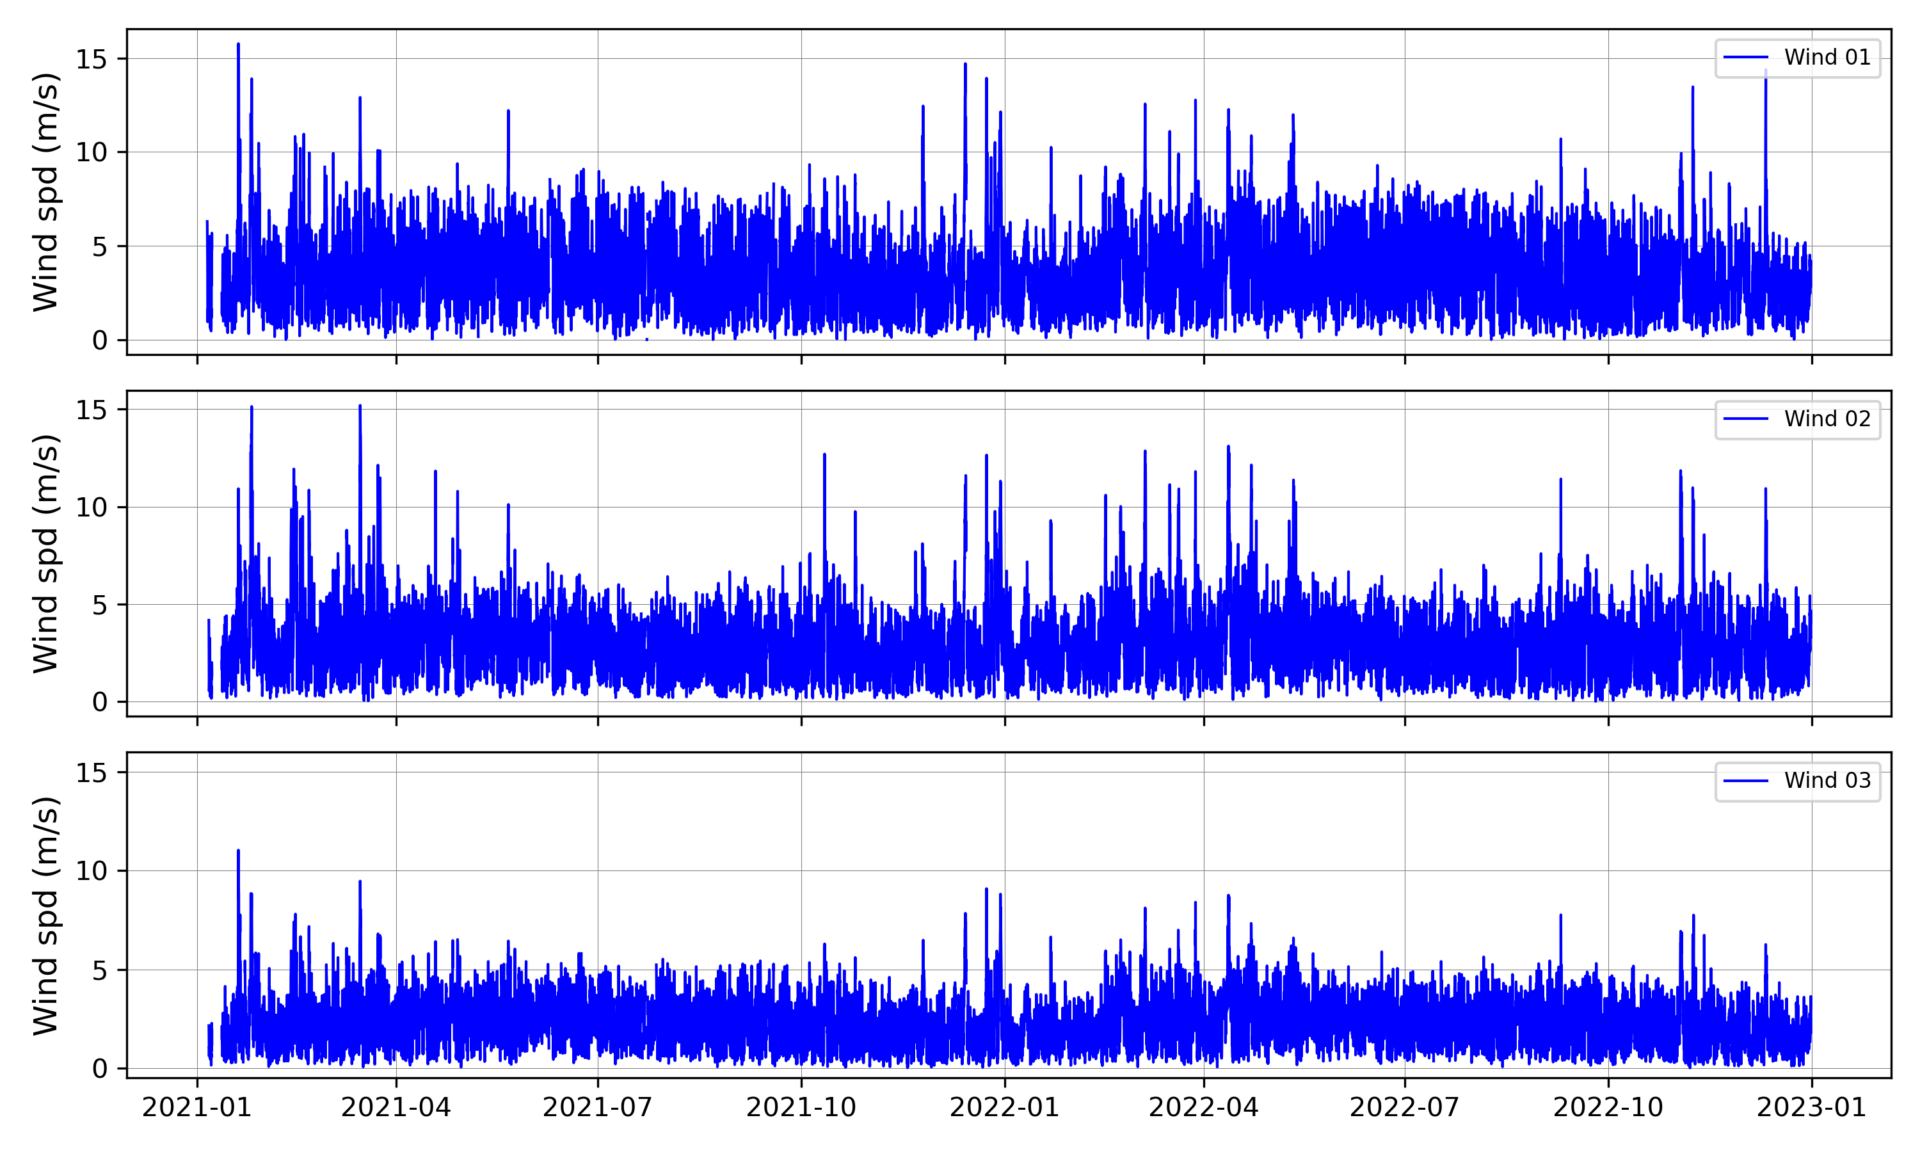
Suppose we have three wind data series obtained from three different wind stations in our model domain, as shown in Figure 1 below.
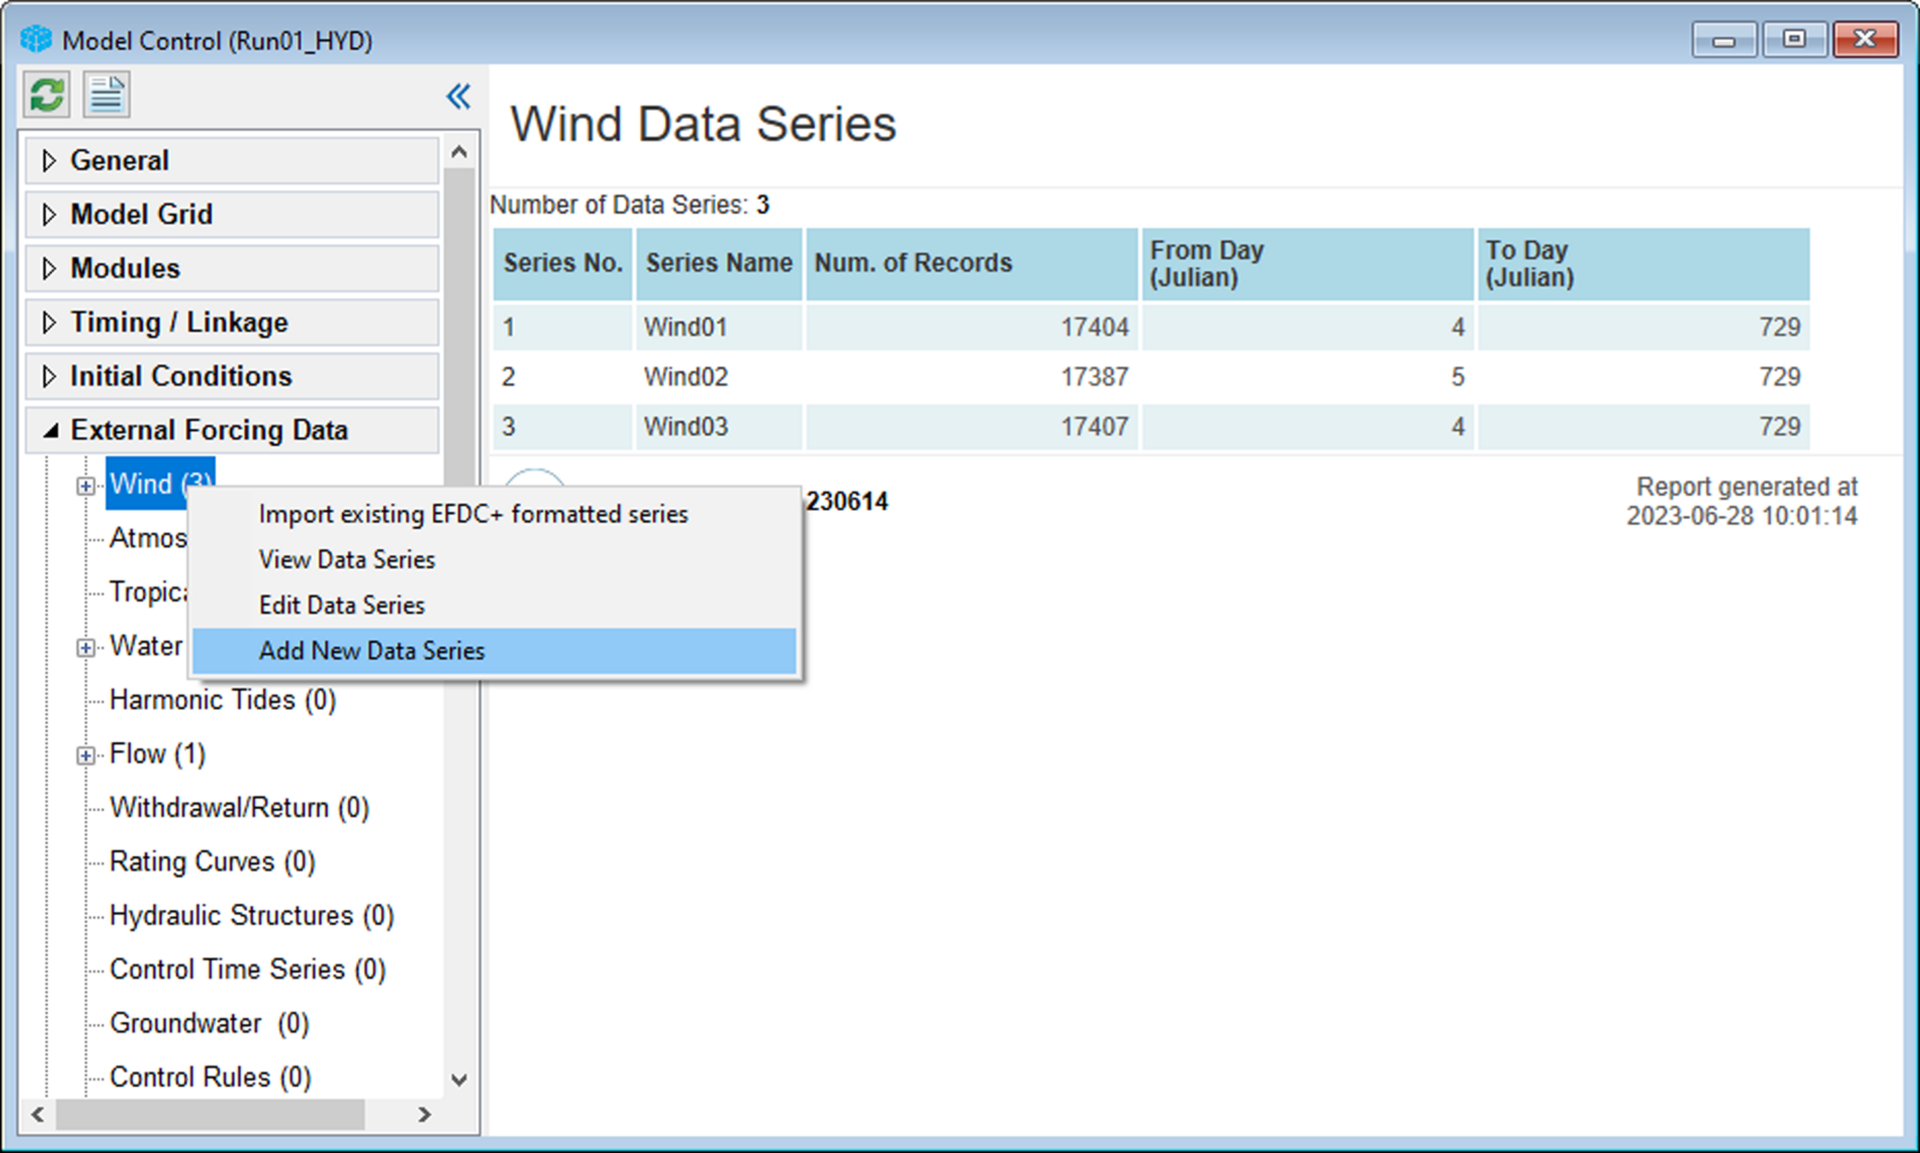
To add a new wind series, Right mouse-click (RMC) on Wind under External Forcing Data, then select Add New Data Series, as shown in Figure 2.
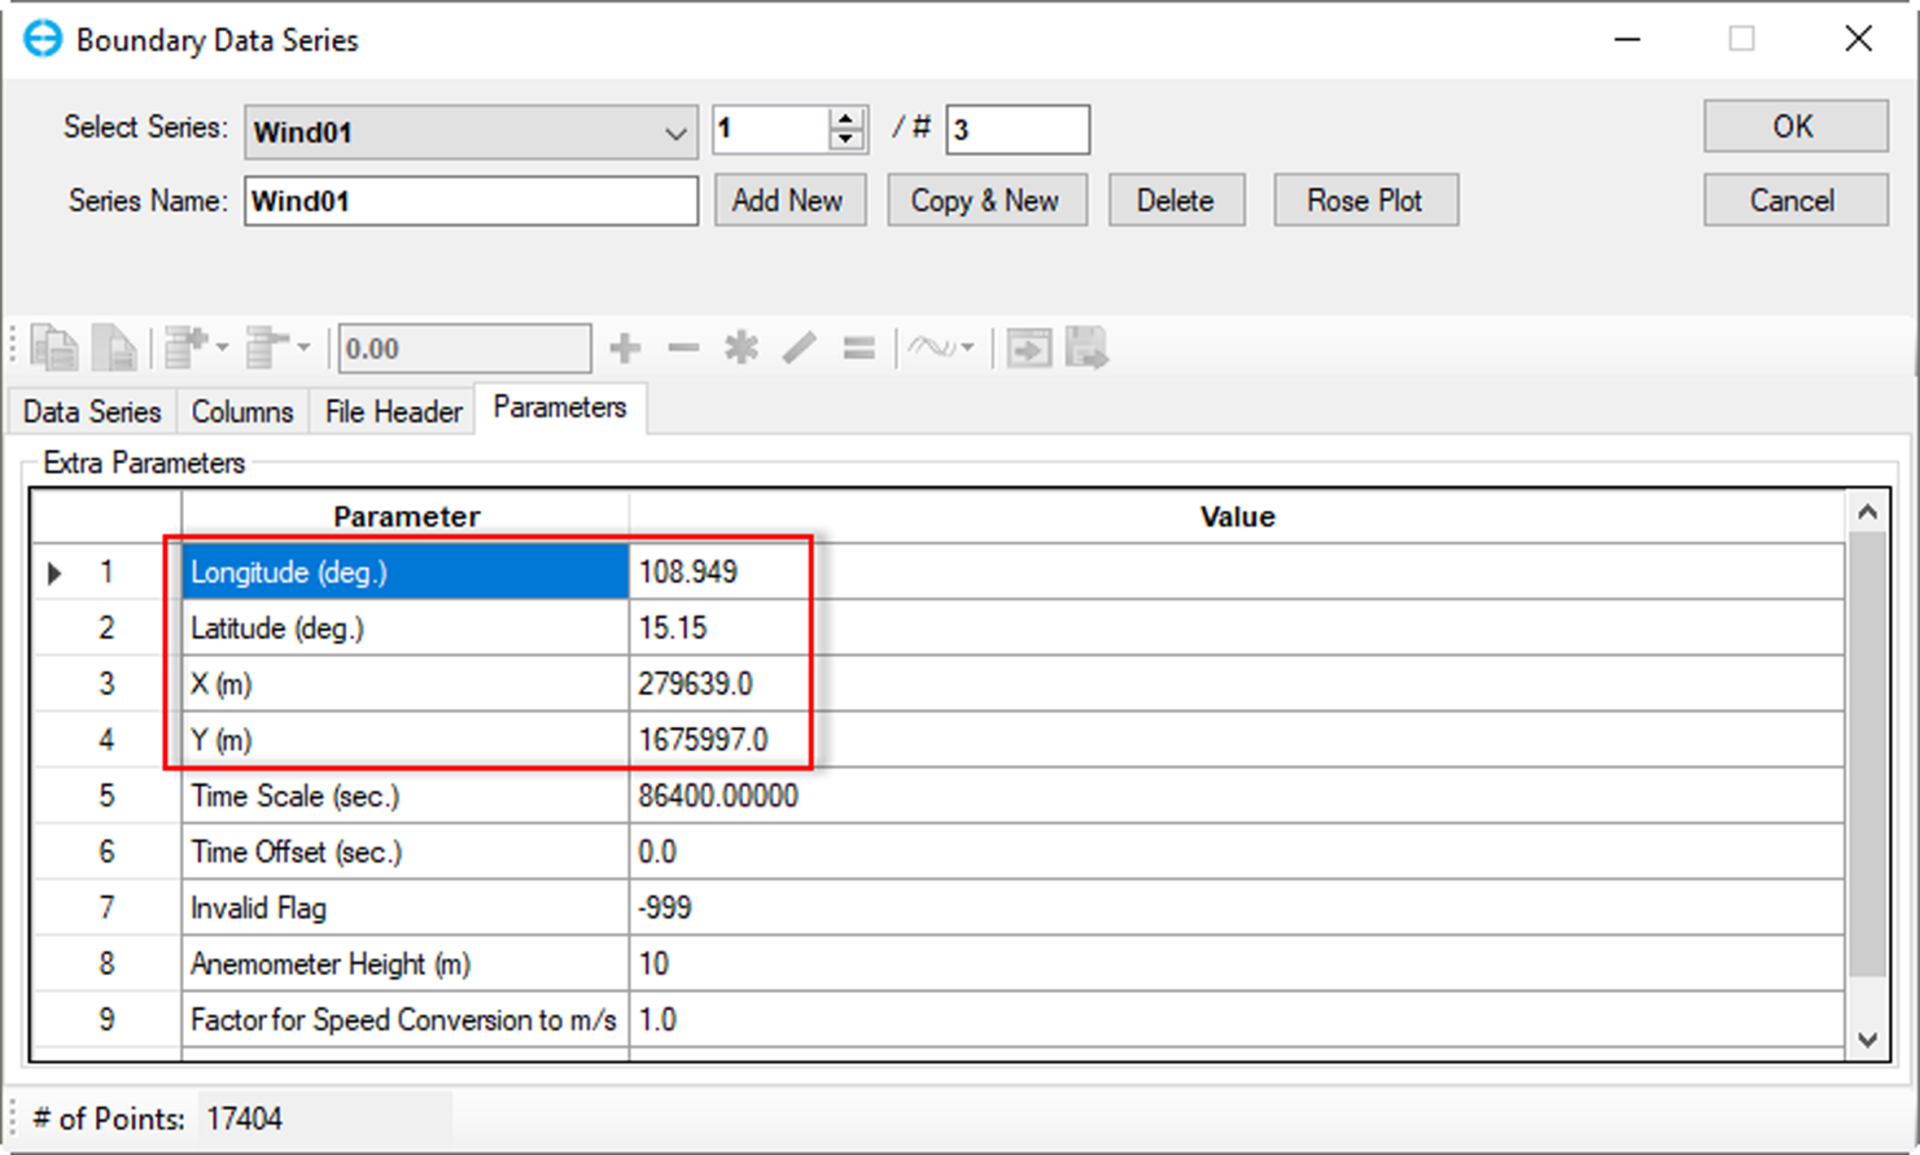
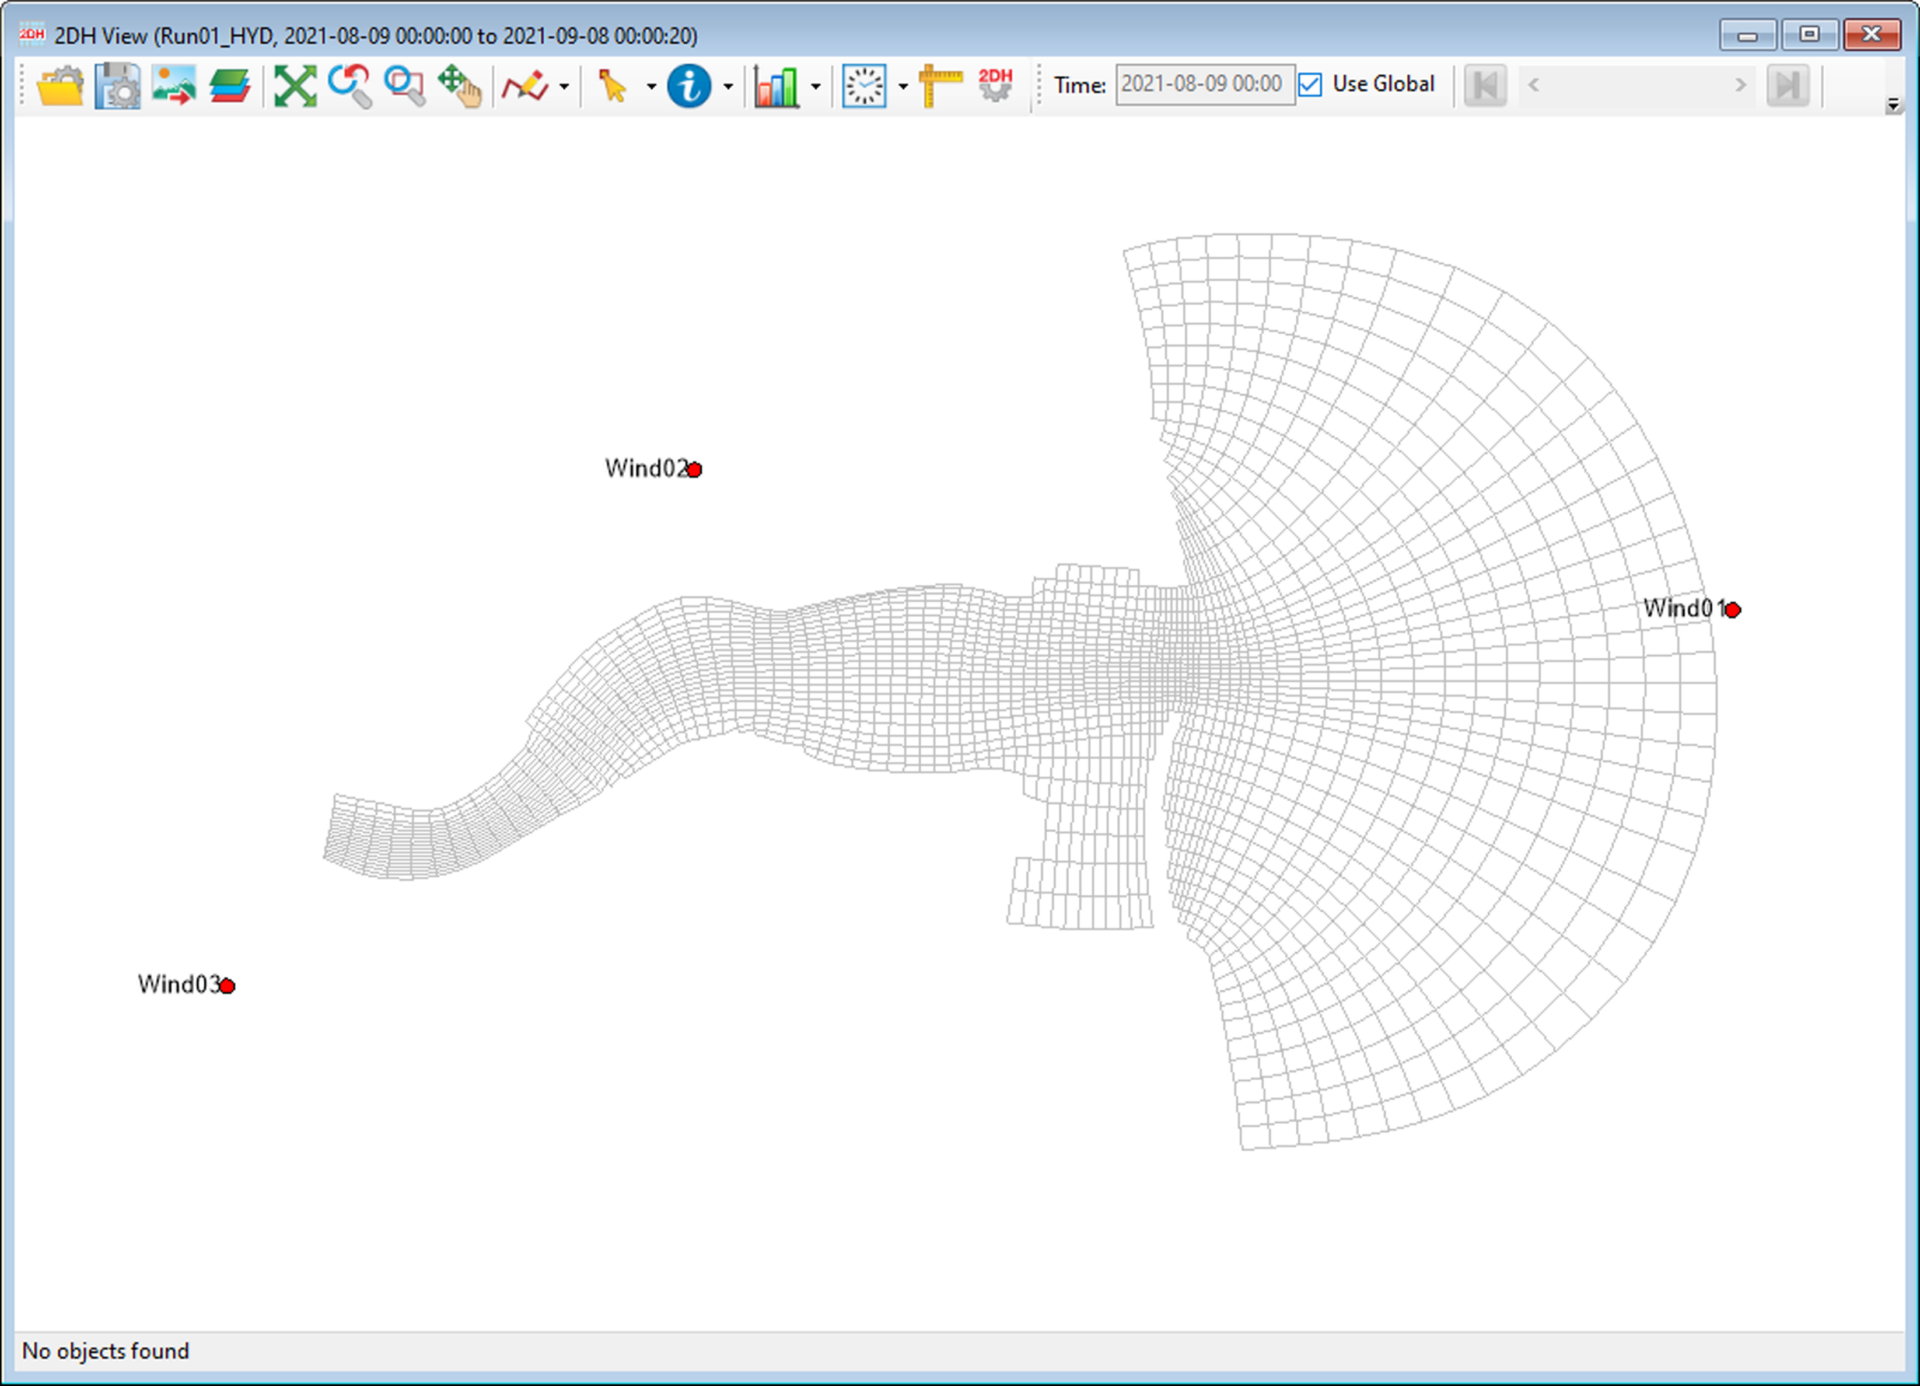
Enter the coordinates of the new wind station. We can enter either UTM coordinates or latitude and longitude (lat/long). If we only enter the lat/long values, then EEMS will automatically calculate the X and Y coordinates based on the lat/long values provided and vice versa (Figure 3). For this conversion, EEMS uses the UTM zone assigned to the model in the Model Grid option under the Model Control form. An example of a model domain with three wind stations is shown in Figure 4.
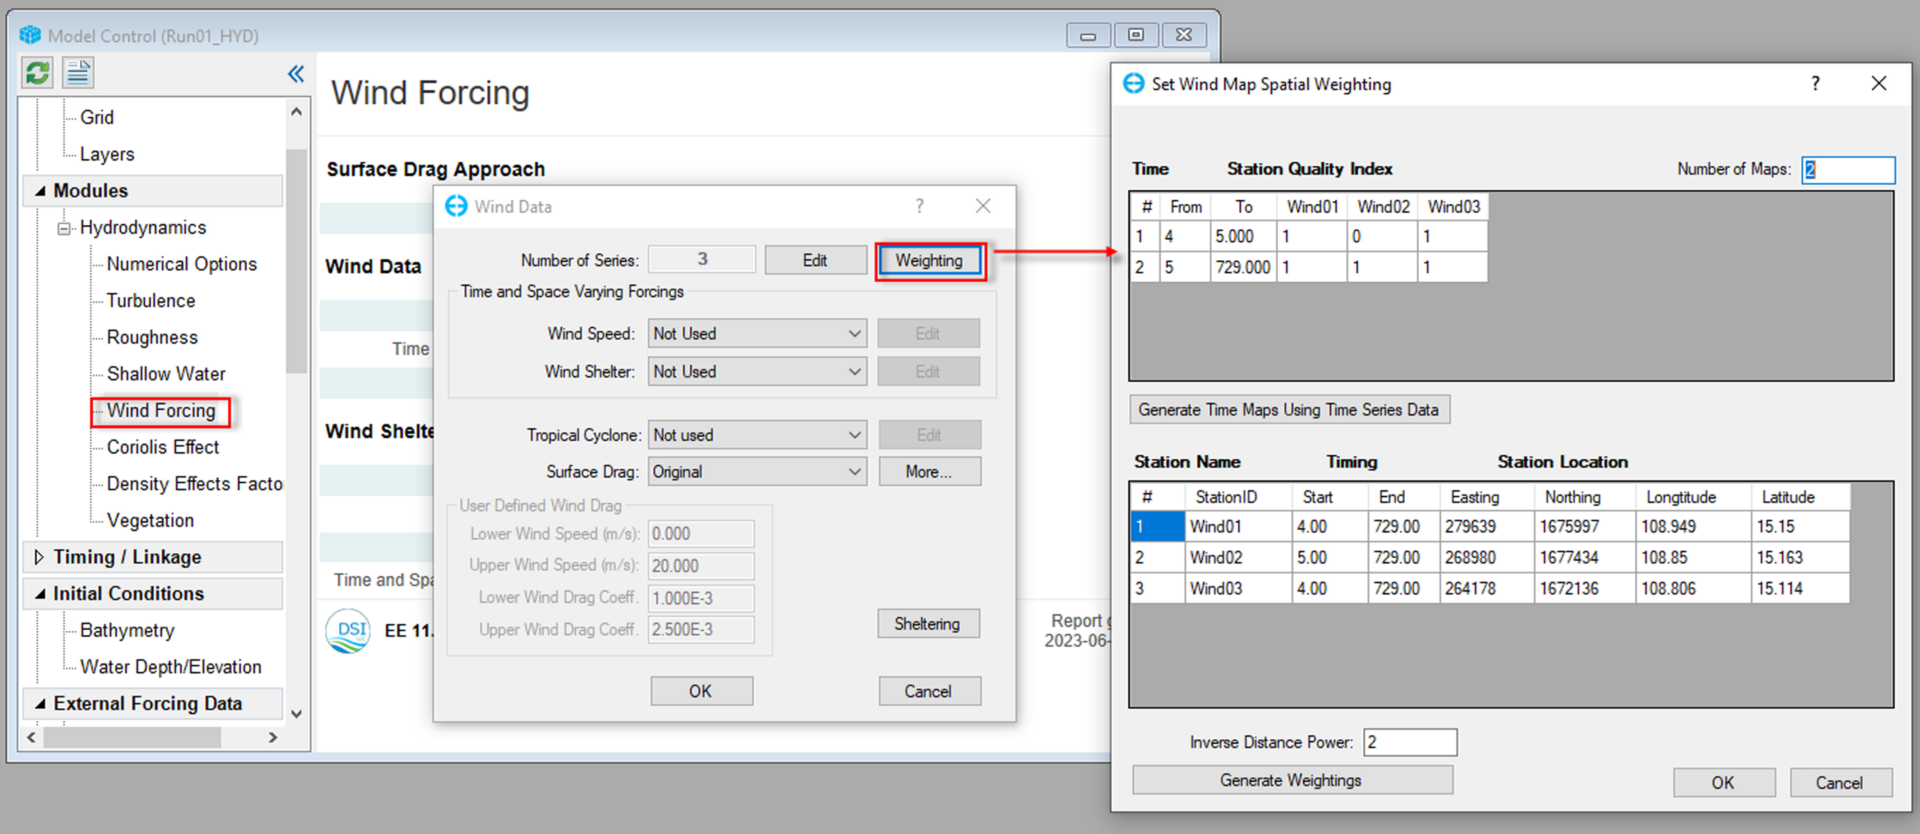
EE handles the calculation of the wind station weighting and provides the correct series to EFDC+. The wind series are broken into time blocks, with one time block for each weighting. This approach allows EE to display the stations in a grid format with a quality index that indicates how the user rates each time series and time block within that series. The default quality indexes are set by EE after selecting the Generate Weightings button. EE automatically generates the quality index with a minimum value of 0 and a maximum value of 1, as shown in Figure 5. We can adjust these quality indexes based on various factors, such as the quality of the wind data series, the distance from the wind station to the model domain, or an intervening geographical feature. In a case where there is a mountain or valley between the station and the model domain, we will select a lower value for the quality index. If another time series with a higher weighting is available for that period, it will have a greater impact on the model.
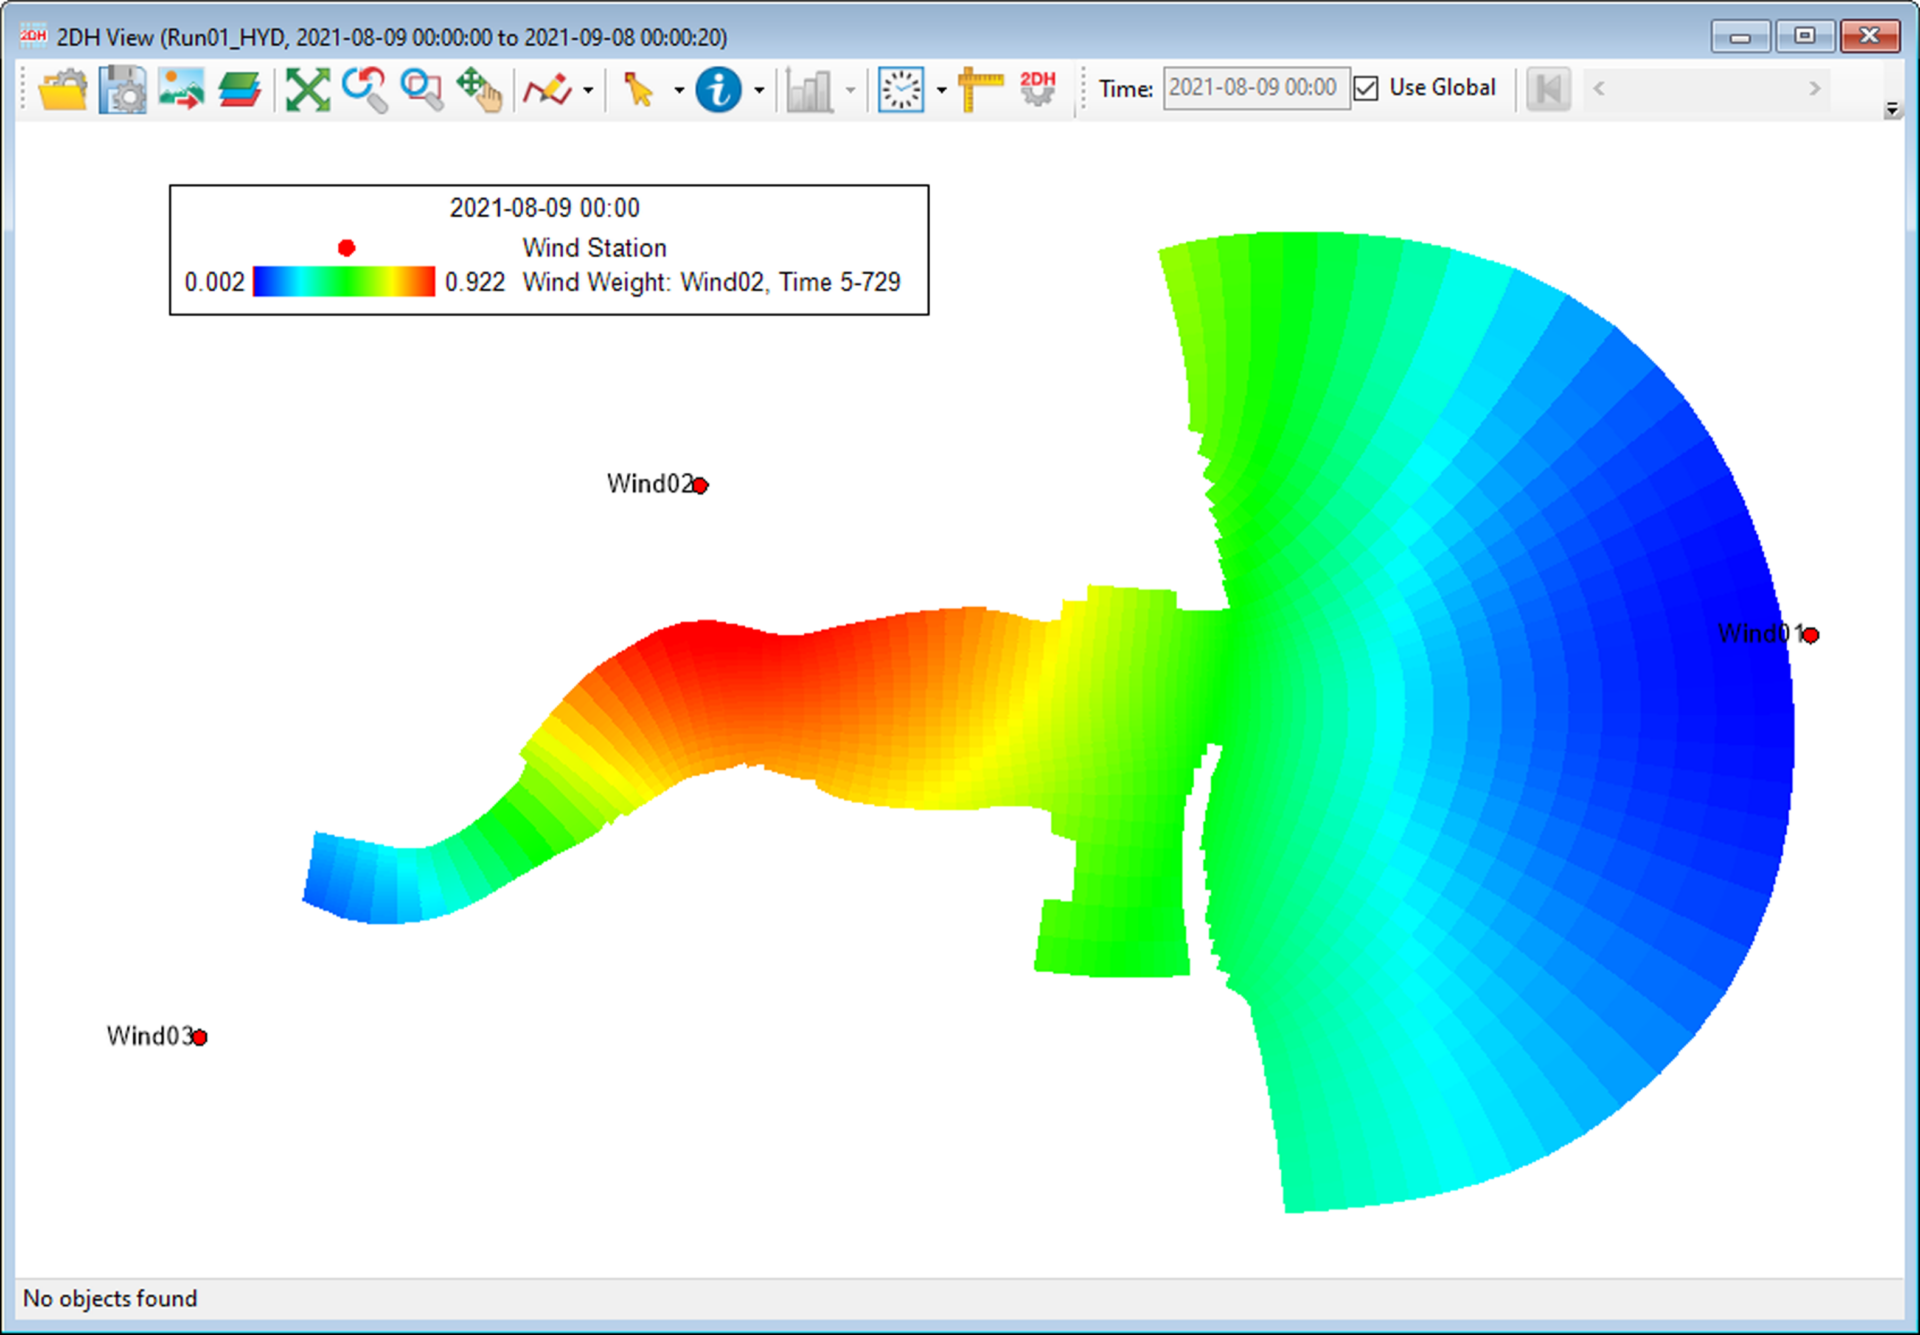
EE generates a weighting map, as shown in Figure 6. This map is based on the inverse squared distances from the cells to the wind stations and the qualitative coefficients for each time series. It includes the number of maps and the corresponding blocks of weighting coefficients.
Either version of the plural is OK, but in the U.S., indexes is generally preferable and having used that once in this paragraph, we should be consistent.
What determines the quality other than the subsequent factors mentioned (distance, intervening geography). To say the quality index depends on the data quality is not very helpful.
See our Knowledge Base for more details about this feature. To try this yourself without buying EEMS, activate EEMS in demo mode. Demo mode activation instructions can be found here.


