EFDC+ Explorer is a powerful and intuitive tool for evaluating models using various types of comparison data. Apart from time series, correlation plots, and vertical profile plots, it allows for many different statistical error calculations. In addition, the latest EE also enables users to automatically report statistical errors to specific images and tables with a range of formats. This blog will guide the user on configuring the recently updated time series calibration tool.
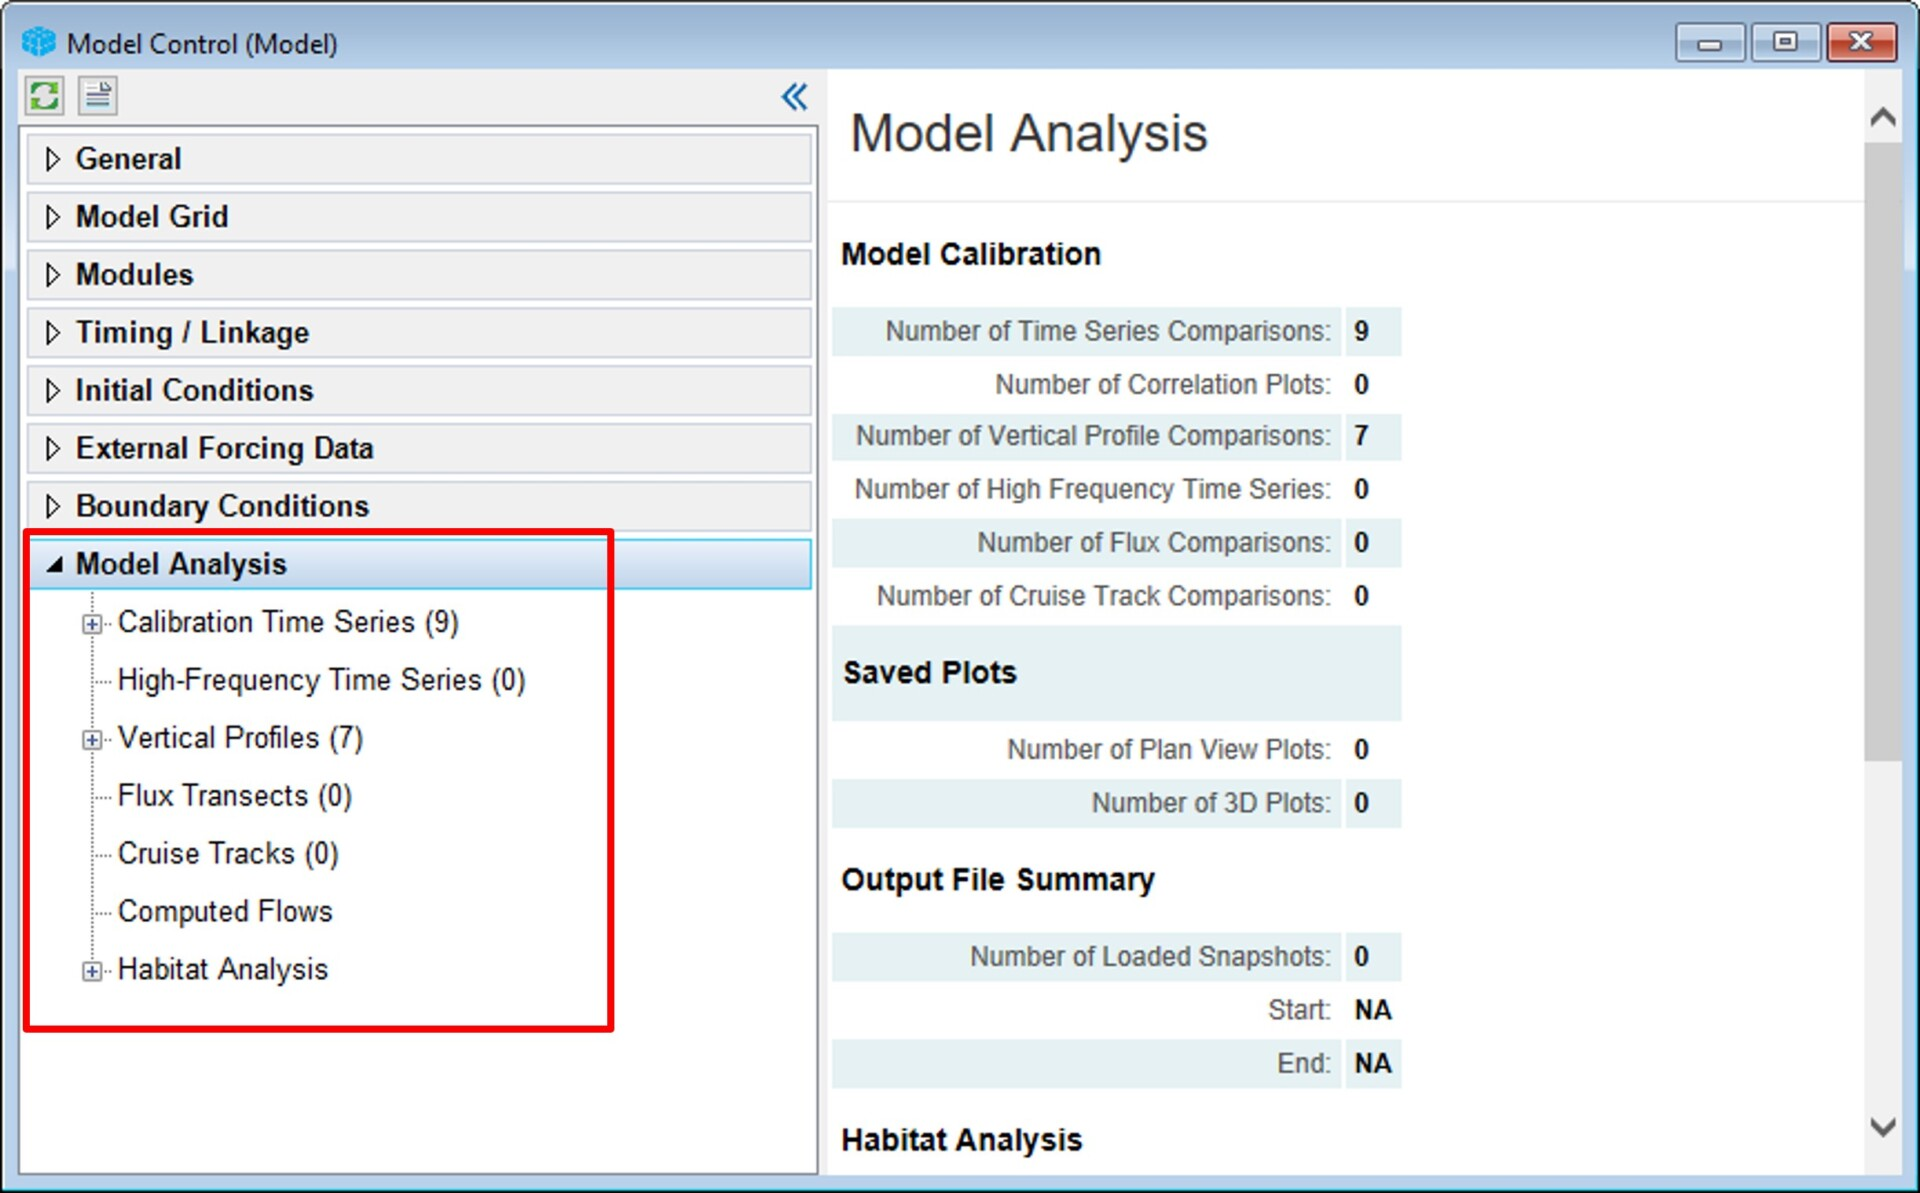
The Calibration Time Series form is accessed from the Model Analysis menu, as shown in Figure 1.
Format for Measured Data
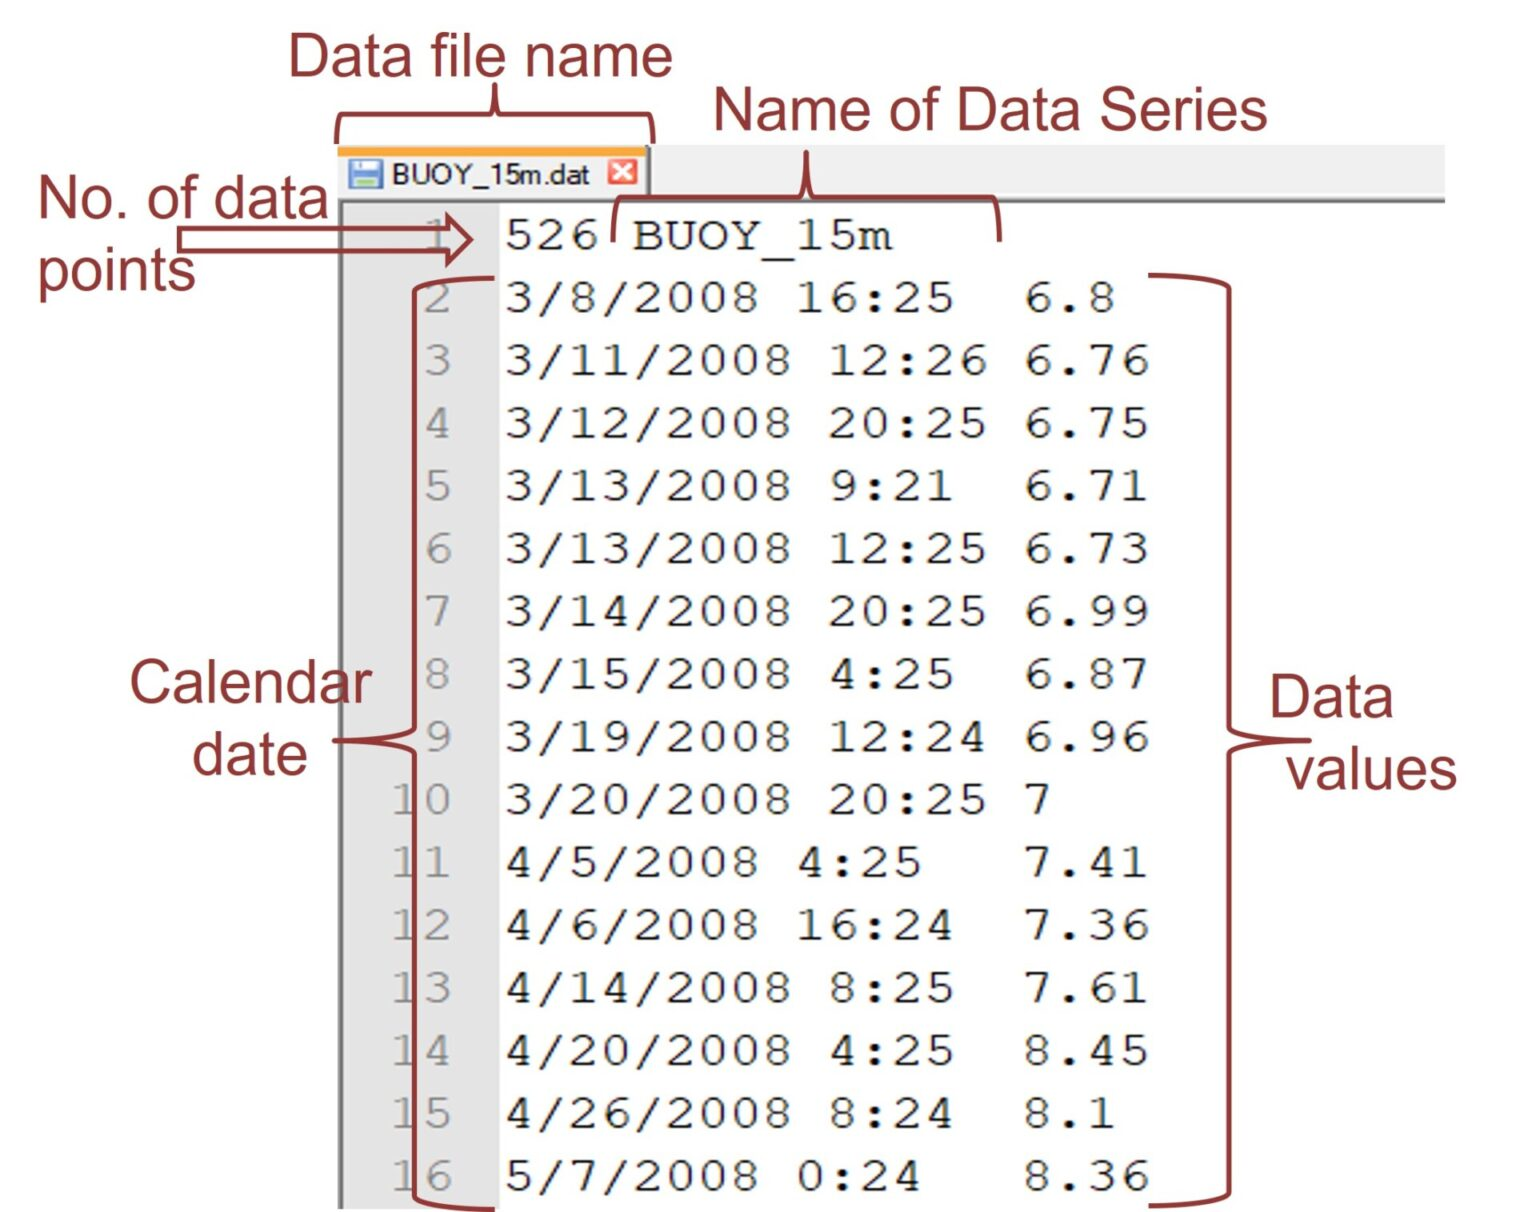
The measured data for each variable should be edited and stored in separate files in _.dat or _.wq format. The format for the time series is shown in Figure 2 as an example. There are two columns in the file. The first is the date and time; Julian or calendar time is acceptable. The second column is the measured data value. We can assign -999 for any missing data, so EE will ignore that point when plotting.
Calibration Time Series
Select the Calibration Time Series under the Model Analysis options to compare model results with measured data. RMC on the Calibration Time Series, then select Define Calibration Series. The Model Calibration: Time Series Comparisons form will be displayed as shown in Figure 3.
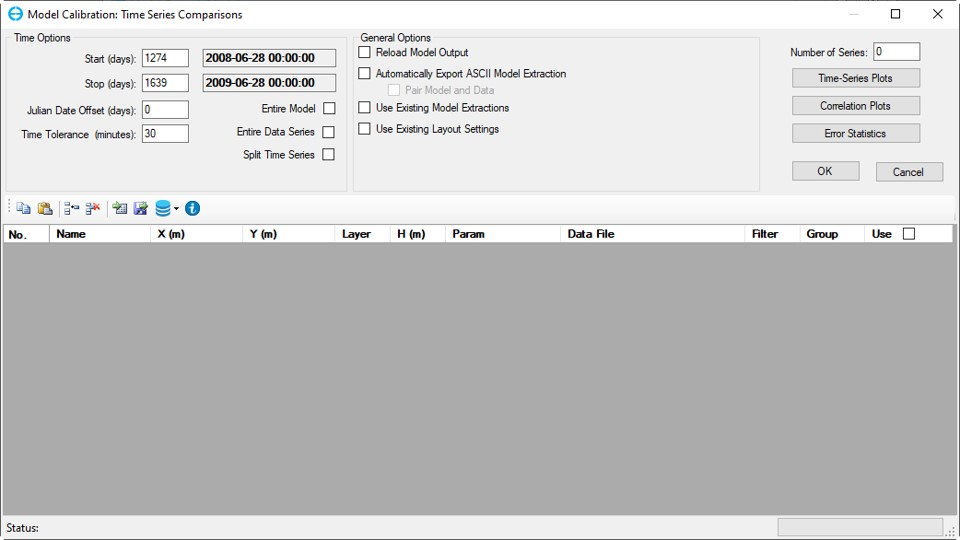
The Number of Time Series field will be “0” when starting the model-data linkage process. Enter the number of stations here, then press the Enter key. EE will create a line in the table for each station.
RMC on the cells in the table to open the Station Information form to define model parameters and data series file paths. Figure 4 shows an example of the completed station information. The user should fill in the station name, location, parameter, and layer. The user should also provide the path of the data file. Complete this form for each station before utilizing the model calibration feature.
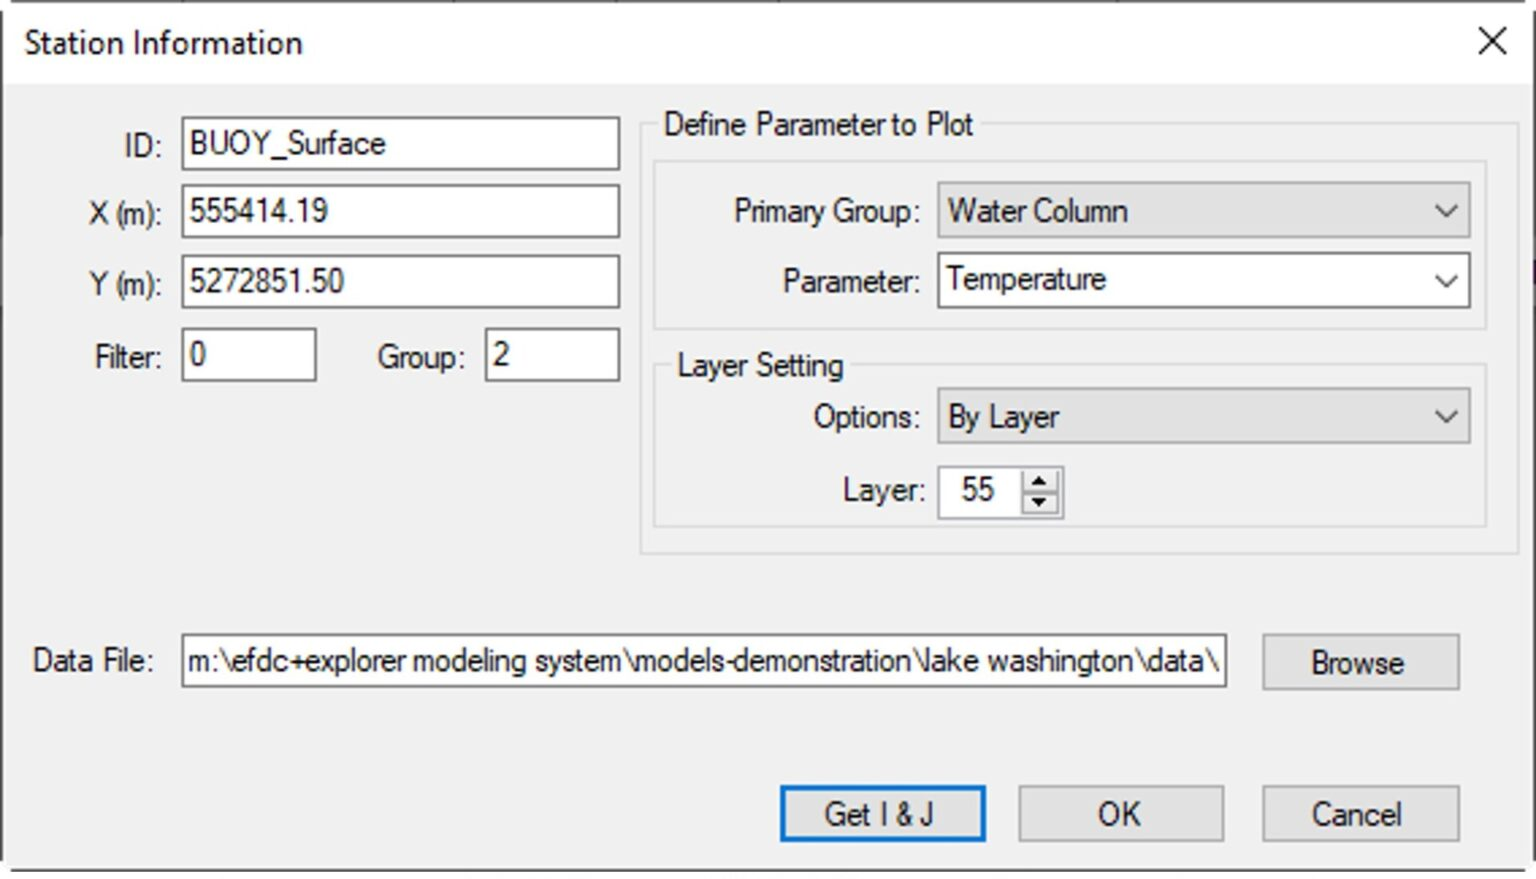
Figure 5 shows an example of the information filled in for each station where EE will compare the model results with the measured data.

View Time Series Plot
To view or export currently defined and enabled plots, select View Time Series Plots button shown in the form in Figure 3. Selecting this will load the EFDC model linkage files (i.e., EE*.OUT), read the observed data files, and then scan the model linkage files to build the model-data plots. The user can press ESC during the model output loading process to abort the loading and plotting. Once EE loads the data, the time series plotting utility is displayed. Figure 6 shows an example of a time series plot. If a particular station is not required, the user can deselect that station in the Use checkbox.
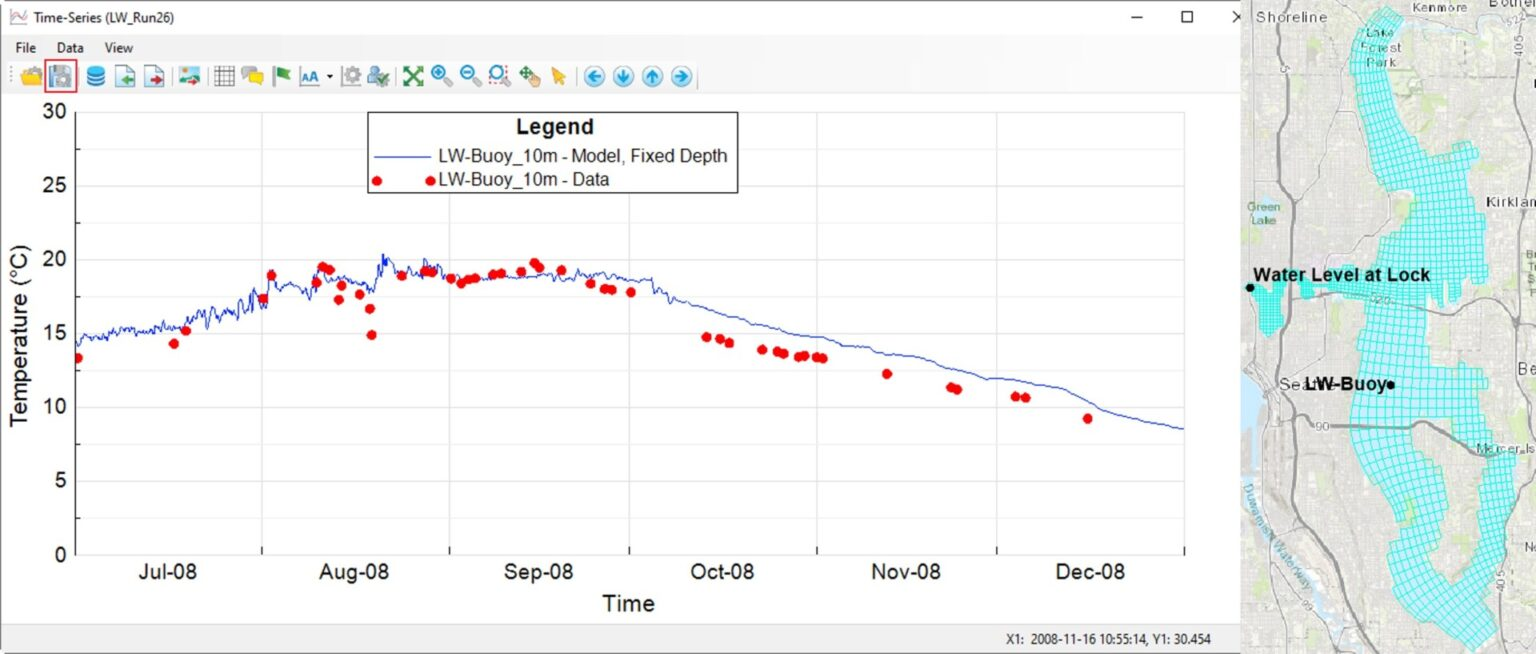
Typically, there are many calibration stations with different parameters. In that case, it is helpful to format the time-series plots of one series and then apply this same layout to all the other time series of the same parameter. To do this, click the Save Layout button on the toolbar of the time series (highlighted in Figure 6). This button opens the Save Calibration Time Series Layout form, as shown in Figure 7. If the user checks the Calibration Layout option, EE will save the entire plot format of all time series to a file with the file extension _.CCP. If the user checks the TS Layout option, EE will only save the current time series plot format with the file extension _.TSL. These layouts can later be loaded and edited using the Open Layout button beside the Save Layout button in Figure 6.

You can try this calibration process with our free Lake Washington model using EEMS in demo mode. In subsequent blogs in this series, we will outline how to configure the calibration tool for vertical profile plots, generate statistics and automatically generate comparison figures and statistics at the end of each model run. Please contact us if you have questions or comments on this feature in EEMS.


