Impact of Elevation on DO Saturation
A commonly recognized phenomenon is that as the altitude increases, the atmospheric pressure decreases. Decreased atmospheric pressure leads to a decrease in the oxygen saturation in water at higher altitudes. Therefore, the rivers and lakes at high elevations have a decreased capacity to carry dissolved oxygen (DO). As DO is an important water quality indicator, it is vital to capture this effect when simulating eutrophication at high altitudes. This blog describes how EFDC+ has recently been enhanced to support the impact of elevation on DO saturation in a waterbody.
The saturated concentration of DO can be determined based on temperature, salinity, and elevation using an empirical formula in the form:
DOs = f(T) · f(S) · f(z) (Eq. 1)
Where DOs is the saturated DO, f(T) and f(S) indicate the dependencies of the saturated DO on temperature and salinity, which decreases as temperature and salinity increase, and f(z) is the influence of oxygen partial pressure on the saturated DO. EFDC+ earlier included an empirical formulation from Garcia and Gordon (1992) to account for changes in DO due to temperature and salinity. Several new options have been added to the EFDC+ code for the upcoming EEMS10.4. It now includes formulations for the effect of atmospheric pressure on DO saturation at an elevation as described by the cubic polynomial according to Chapra et al. (2021):
f(z) =1−0.11988·z+6.10834×10⁻³·z2−1.60747×10⁻⁴·z3 (Eq. 2)
Where z is the elevation in km. Likewise, Zison et al. (1978) has also proposed a linear elevation adjustment factor of:
f(z) =1−0.1148·z (Eq. 3)

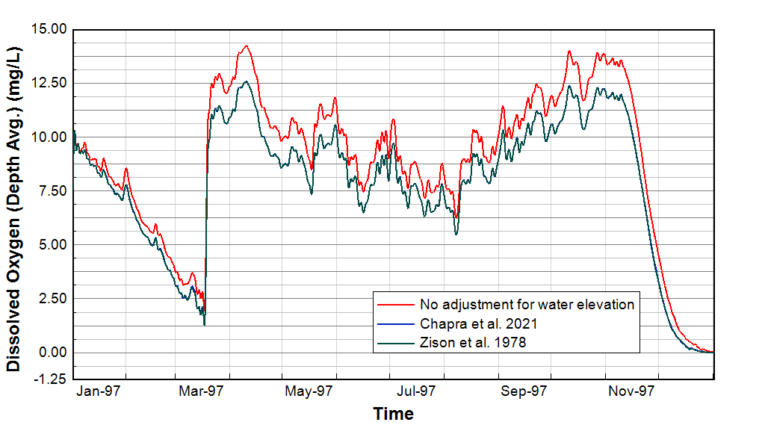
Figure 2. DO concentration in the middle of a high-elevation lake in North America.
To test the impact of these new options, we compared the options using a WQ simulation of a high-elevation lake in North America. The lake is situated approximately 1000 m (3,300 feet) above sea level, equivalent to a city such as Calgary in Alberta, Canada, or Salt Lake City, Utah. Three model simulations were run using the original Garcia and Gordon (1992) for DO saturation for the following cases:
- No adjustment for water elevation
- Chapra et al. (2021) adjustment for water elevation
- Zison et al. (1978) adjustment for water elevation
The results of the DO concentration at the middle of the lake for one year from January 15, 1997, to January 16, 1998, are shown in Figure 2. The elevation adjusted DO concentrations demonstrate a drop of approximately 1.5 mg/L from mid-March to mid-November, when compared to the modeled DO concentration without elevation adjustment. This result is explained as the impact of atmospheric pressure on DO saturation, which is lower due to the higher elevation. Overall there is no appreciable difference in the results using the two different elevation adjustment formulae described above.
In conclusion, the effect of atmospheric pressure on DO saturation at elevation is better represented in the upcoming EFDC+ version. This feature allows the models to consider more factors in the calculation of DO, especially for high elevation water bodies.
For more information on the EFDC models and what EFDC+ can do for you, contact the DSI team today.
Talk to the experts
References
Chapra, Steven C., Luis A. Camacho, and Graham B. McBride. 2021. Impact of Global Warming on Dissolved Oxygen and BOD Assimilative Capacity of the World’s Rivers: Modeling Analysis. Water 13, no. 17: 2408. https://doi.org/10.3390/w13172408
Garcia, Herncin E., Gordon, Louis I., (1992), Oxygen solubility in seawater: Better fitting equations. Limnology and Oceanography, 37, https://doi.org/10.4319/lo.1992.37.6.1307
Zison, S. W., W. B. Mills, D. Diemer & C. W. Chen, 1978. Rates,Constants, and Kinetic Formulations in Surface Water QualityModeling. U.S. Environmental Protection Agency: 317 pp.


