

Following the successful thermal dynamic simulation for Lake Mendota, DSI developed a three-dimensional water quality model using EEMS to generate predictions of eutrophic characteristics, including dissolved oxygen levels, algal concentrations, and nutrient rates.
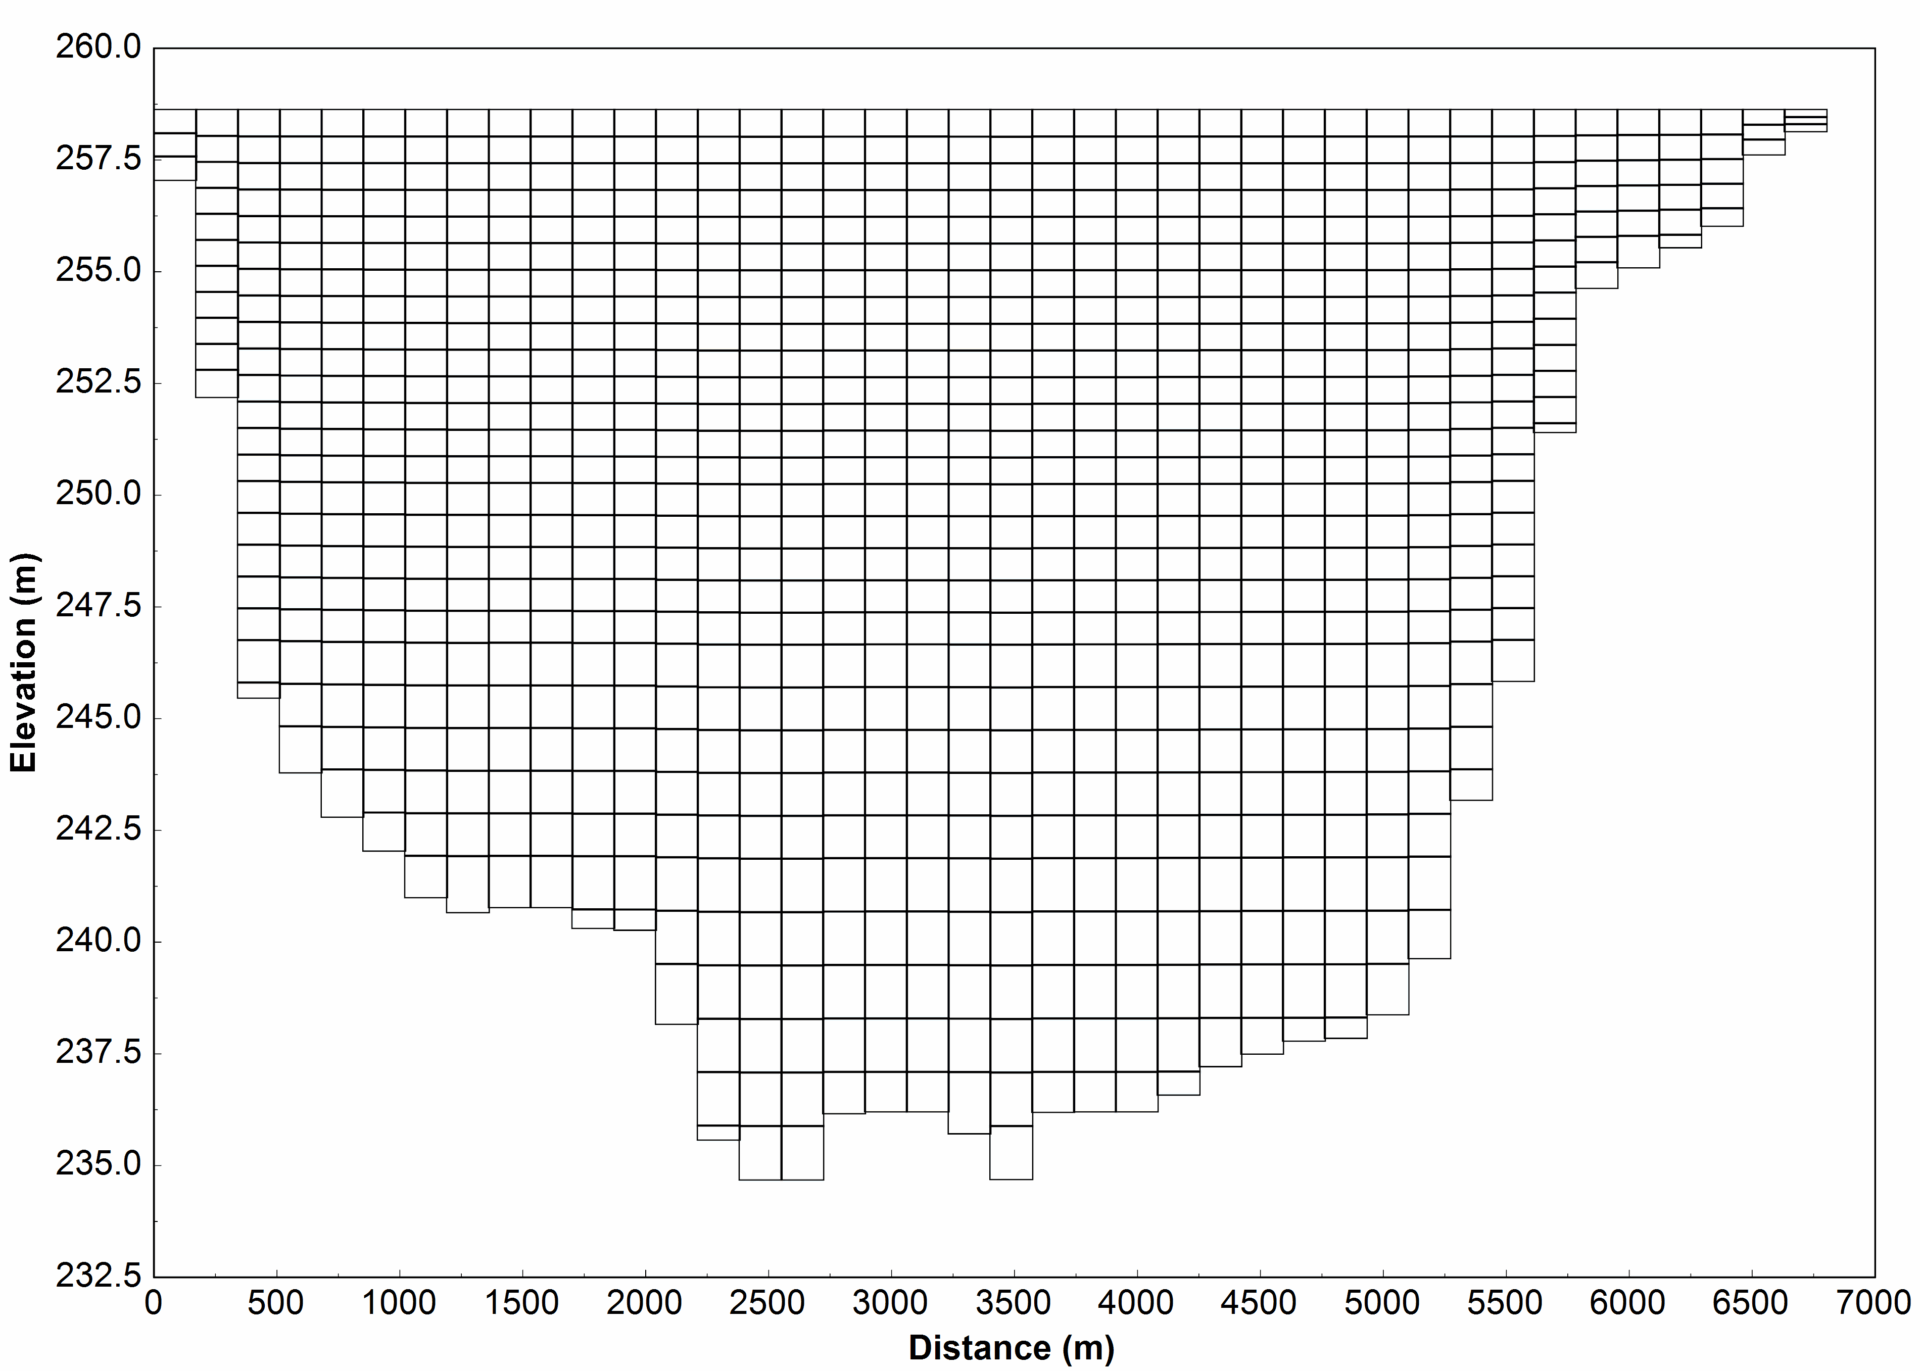
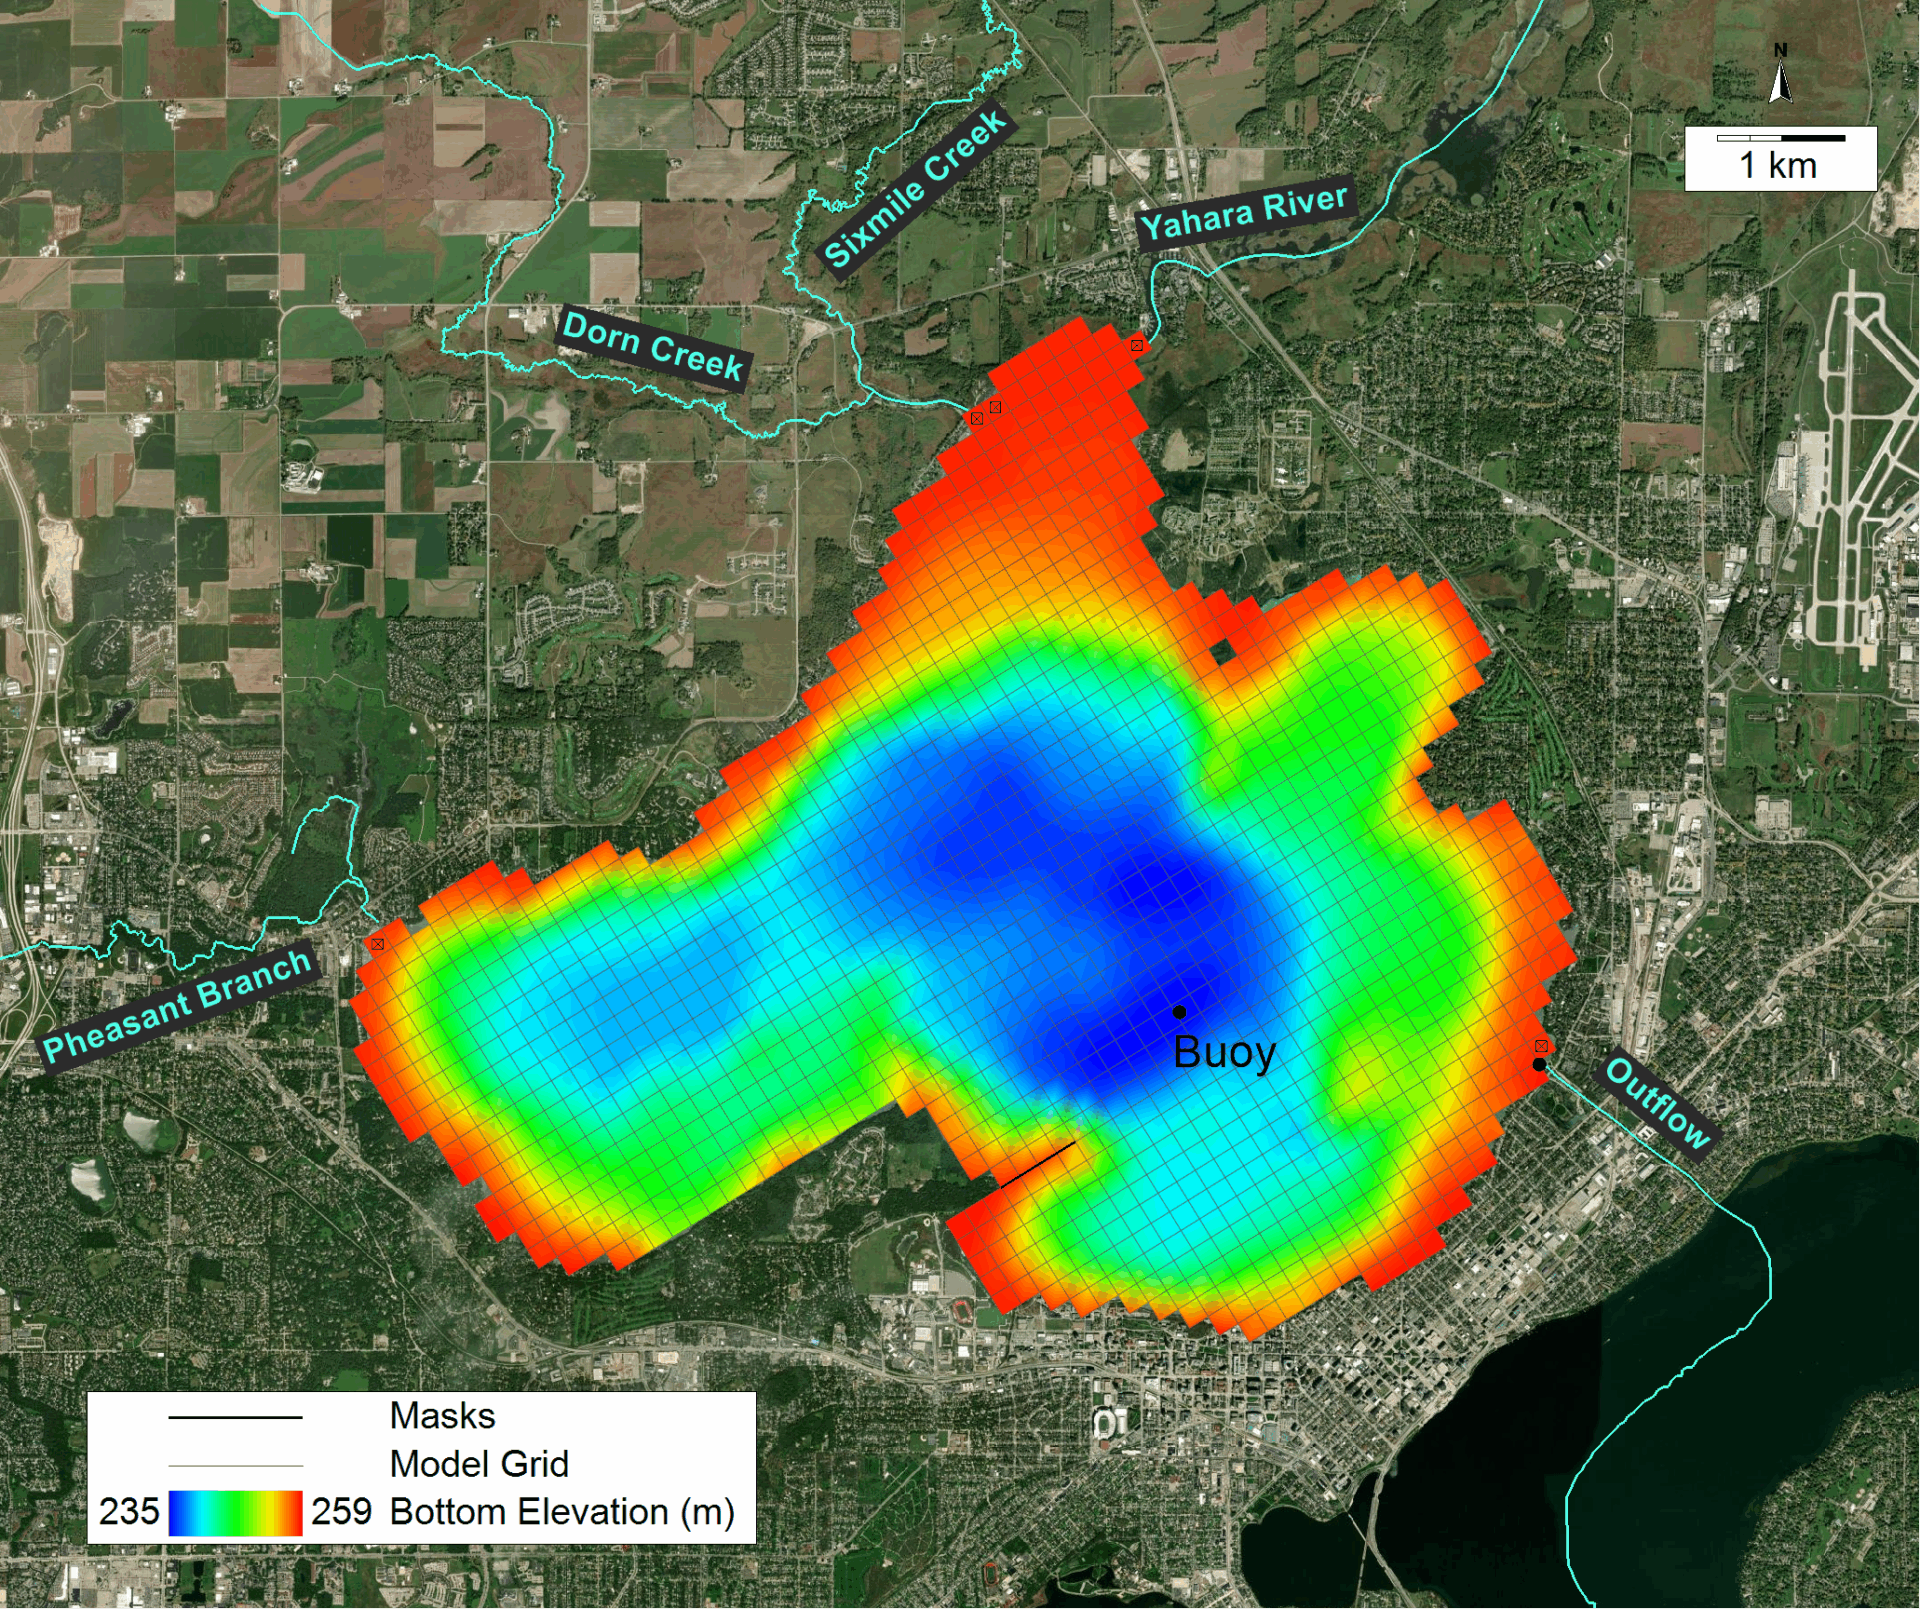
The model setup is preserved from the temperature simulation, using a high-resolution three-dimensional grid configured with 1405 horizontal cells and 30 vertical Sigma-Zed layers (Figure 1 and Figure 2). This vertical characterization allows the capture of detailed water column dynamics. The water quality simulation included two key biota groups – Diatoms and Cyanobacteria – representing primary phytoplankton communities. Sediment fluxes at the benthic boundary were assumed to be both spatially and temporally constant for model stability. The model runs for 5 years, from January 1st, 2017, through December 31st, 2022. The model’s numerical stability is also ensured by running with a fixed time step of 20 seconds for the hydrodynamic model and a kinetic step of 60 seconds for the water quality while the computational efficiency is optimized.
During the model calibration process, we focused on fitting the model output with observational data collected at the buoy that are openly accessible via the Environmental Data Initiative (EDI) portal. We also documented the model’s sensitivity to significant water quality parameters. The most sensitive parameters and their literature-based value range are tabulated in Table 1. Our observation is that the EFDC eutrophication model of Lake Mendota was most influenced by the phytoplankton-related parameters, including maximum growth rates, maximum basal metabolism rate, maximum predation rate, and temperature effects on growth.
Table 1. Sensitivity analysis results for Lake Mendota water quality calibration, presenting sensitive parameters by constituent with recommended parameter ranges
| Constituent | Parameter | Parameter range based on literature |
Total Phytoplankton | Maximum basal metabolism rate for Cyanobacteria/Diatoms | Cyanobacteria: 0.01 – 0.06 (1/day), Diatoms: 0.05-0.17 |
| Maximum predation rate for Cyanobacteria/Diatoms | Cyanobacteria: 0.01 – 0.06 (1/day), Diatoms: 0.01-0.1 | |
| Maximum growth rate for Cyanobacteria/Diatoms | Cyanobacteria: 2-5, Diatoms: 1.3-3.6 (1/day) | |
| Background light extinction coefficient | 0.45 – 0.55 (1/m) | |
| Light extinction due to DOM and Chl-a | 0.01 – 0.07 (1/m per mg/L) | |
| Temperature effect on growth | Temp. coeff. below and above optimal = 0.001-0.01 | |
| Effect of temperature on Metabolism | 0.05 – 0.08 | |
| PO4 and NO2+NO3 nutrient flux | – | |
Dissolved Oxygen | Maximum basal metabolism rate for Cyanobacteria/Diatoms | Cyanobacteria: 0.01 – 0.06 (1/day), Diatoms: 0.05-0.17 |
| Maximum predation rate for Cyanobacteria/Diatoms | Cyanobacteria: 0.01 – 0.06 (1/day), Diatoms: 0.01-0.1 | |
| Maximum growth rate for Cyanobacteria/Diatoms | Cyanobacteria: 2-5, Diatoms: 1.3-3.6 (1/day) | |
| Light extinction due to DOM and Chl-a | 0.01 – 0.07 (1/m per mg/L) | |
| Temperature effect on growth | Temp. coeff. below and above optimal = 0.001-0.01 | |
| Effect of temperature on Metabolism | 0.05 – 0.08 | |
| PO4, NH4, NO2+NO3, and SOD nutrient flux | – | |
| Phosphate | Phosphorus half-saturation for Cyanobacteria/Diatoms | Cyanobacteria: 0.001-0.05, Diatoms: 0.001-0.025 |
| Light extinction due to DOM | 0.01 – 0.07 (1/m per mg/L) | |
| Temperature effect on growth | Temp. coeff. below and above optimal = 0.001-0.01 | |
| PO4 nutrient flux | – | |
| Ammonia | Nitrogen half-saturation for Cyanobacteria/Diatoms | Cyanobacteria: 0.01-0.25, Diatoms: 0.02-0.2 |
| light extinction due to DOM | 0.01 – 0.07 (1/m per mg/l) | |
| Temperature effect on growth | Temp. coeff. below and above optimal = 0.001-0.01 | |
| NH4 and Silica nutrient flux | – | |
Nitrate + Nitrite | Nitrogen half-saturation for Cyanobacteria/Diatoms | Cyanobacteria: 0.01-0.25, Diatoms: 0.02-0.2 |
| Maximum basal metabolism rate for Cyanobacteria/Diatoms | Cyanobacteria: 0.01 – 0.06 (1/day), Diatoms: 0.05-0.17 | |
| Maximum predation rate for Cyanobacteria/Diatoms | Cyanobacteria: 0.01 – 0.06 (1/day), Diatoms: 0.01-0.1 | |
| Maximum growth rate for Cyanobacteria/Diatoms | Cyanobacteria: 2-5, Diatoms: 1.3-3.6 (1/day) | |
| Light extinction due to DOM | 0.01 – 0.07 (1/m per mg/L) | |
| Temperature effect on growth | Temp. coeff. below and above optimal = 0.001-0.01 | |
| NH4, NO2+NO3, SOD, and Silica nutrient flux | – | |
Dissolved Organic Carbon | Maximum basal metabolism rate for Cyanobacteria/Diatoms | Cyanobacteria: 0.01 – 0.06 (1/day), Diatoms: 0.05-0.17 |
| Maximum predation rate for Cyanobacteria/Diatoms | Cyanobacteria: 0.01 – 0.06 (1/day), Diatoms: 0.01-0.1 | |
| Maximum growth rate for Cyanobacteria/Diatoms | Cyanobacteria: 2-5, Diatoms: 1.3-3.6 (1/day) | |
| Background light extinction coefficient | 0.45 – 0.55 (1/m) | |
| Temperature effect on growth | Temp. coeff. below and above optimal = 0.001-0.01 | |
| Effect of temperature on Metabolism | 0.05 – 0.08 | |
| PO4 and NO2+NO3 nutrient flux | – |
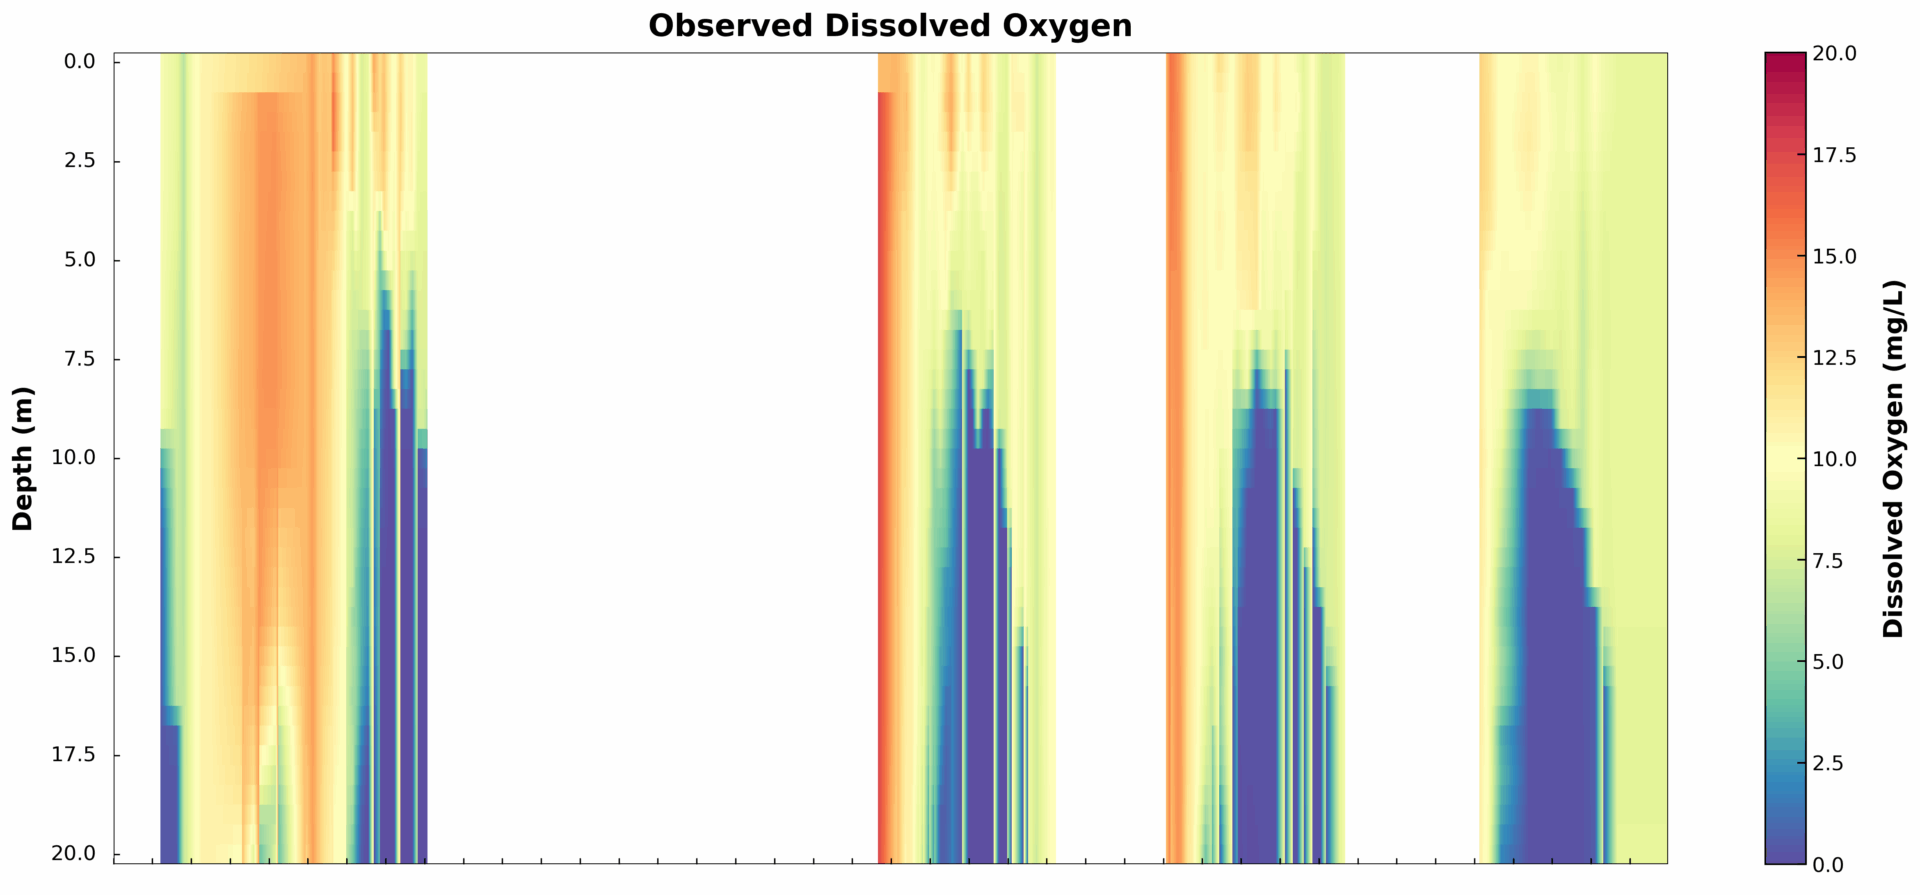
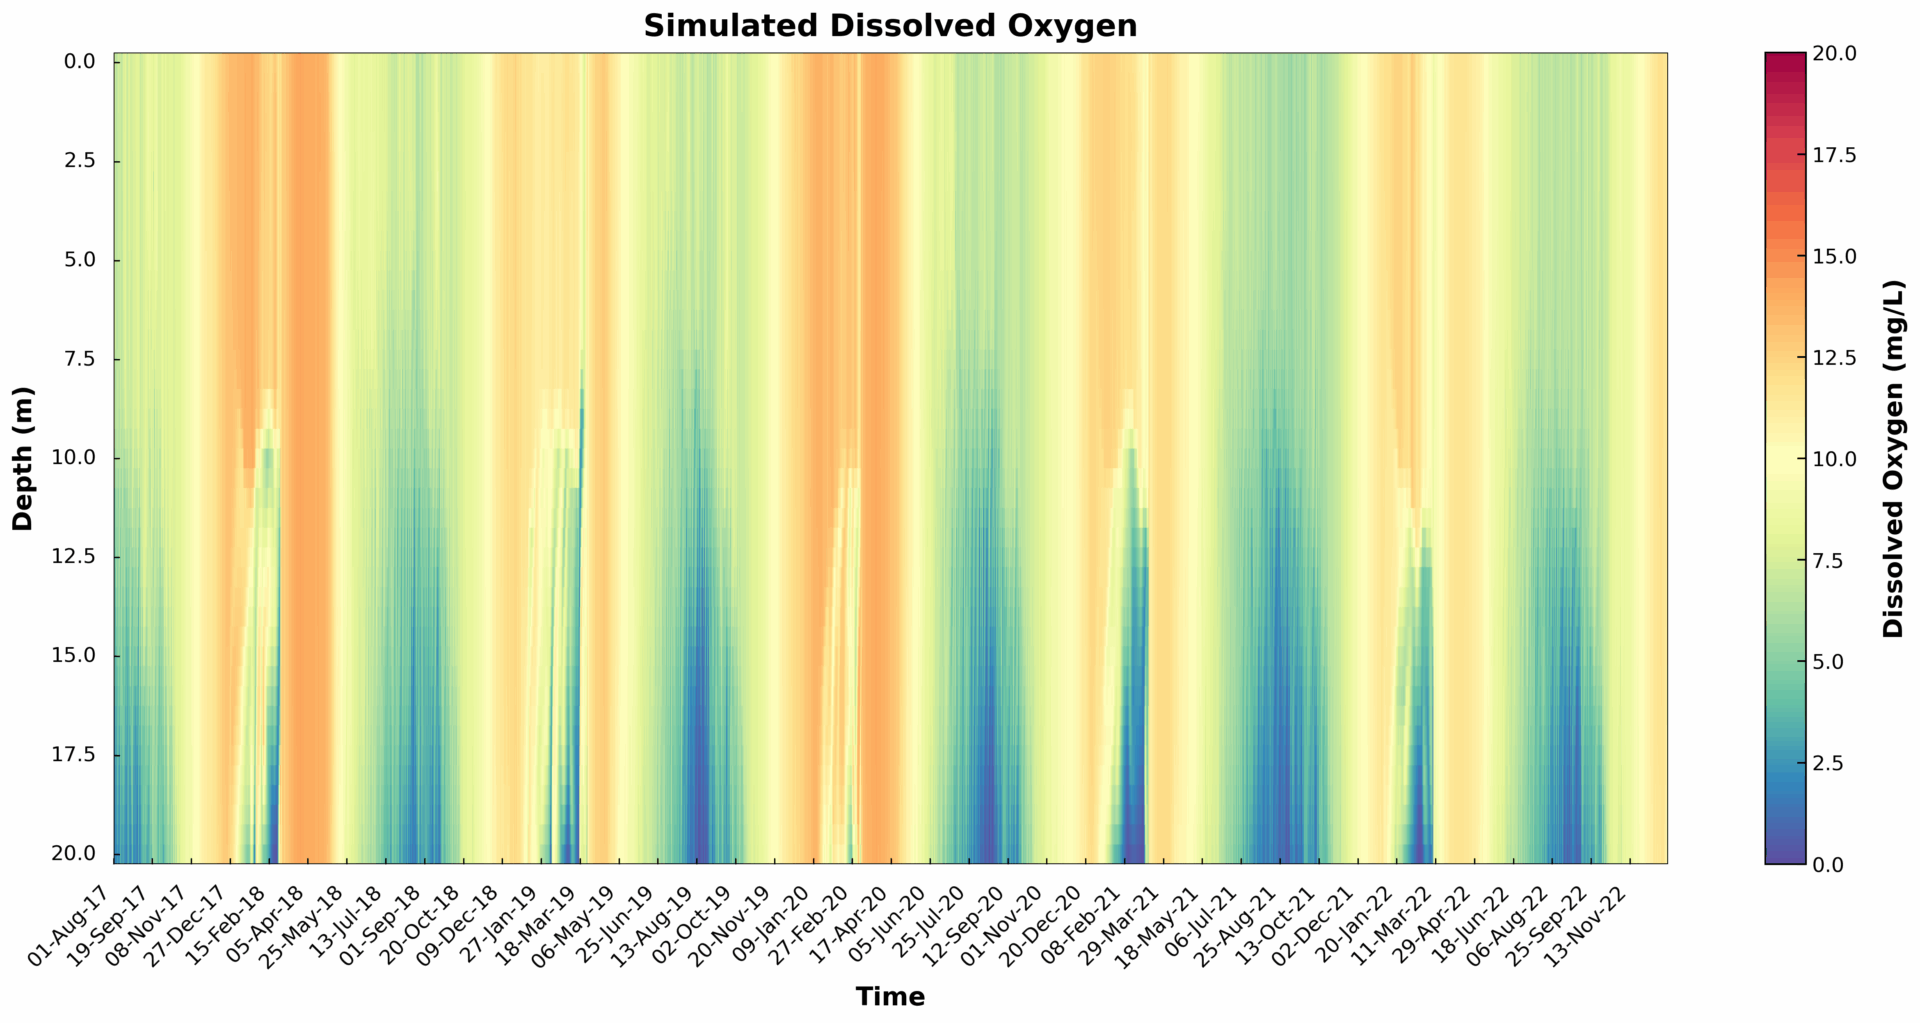
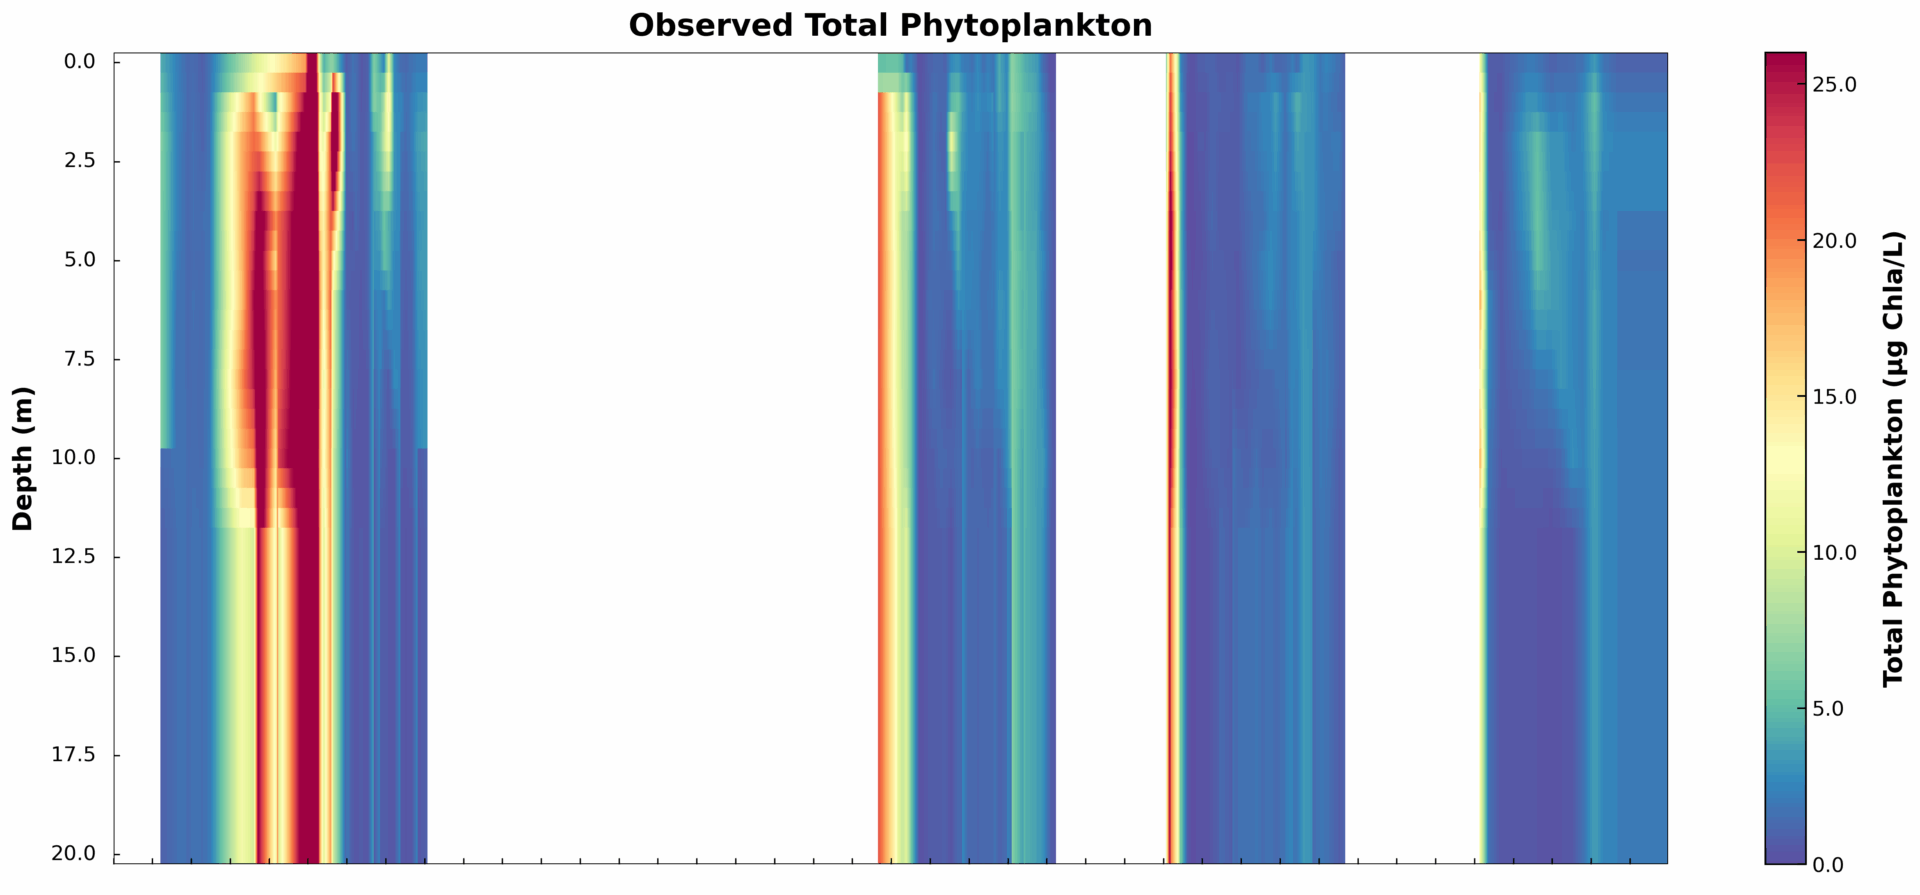
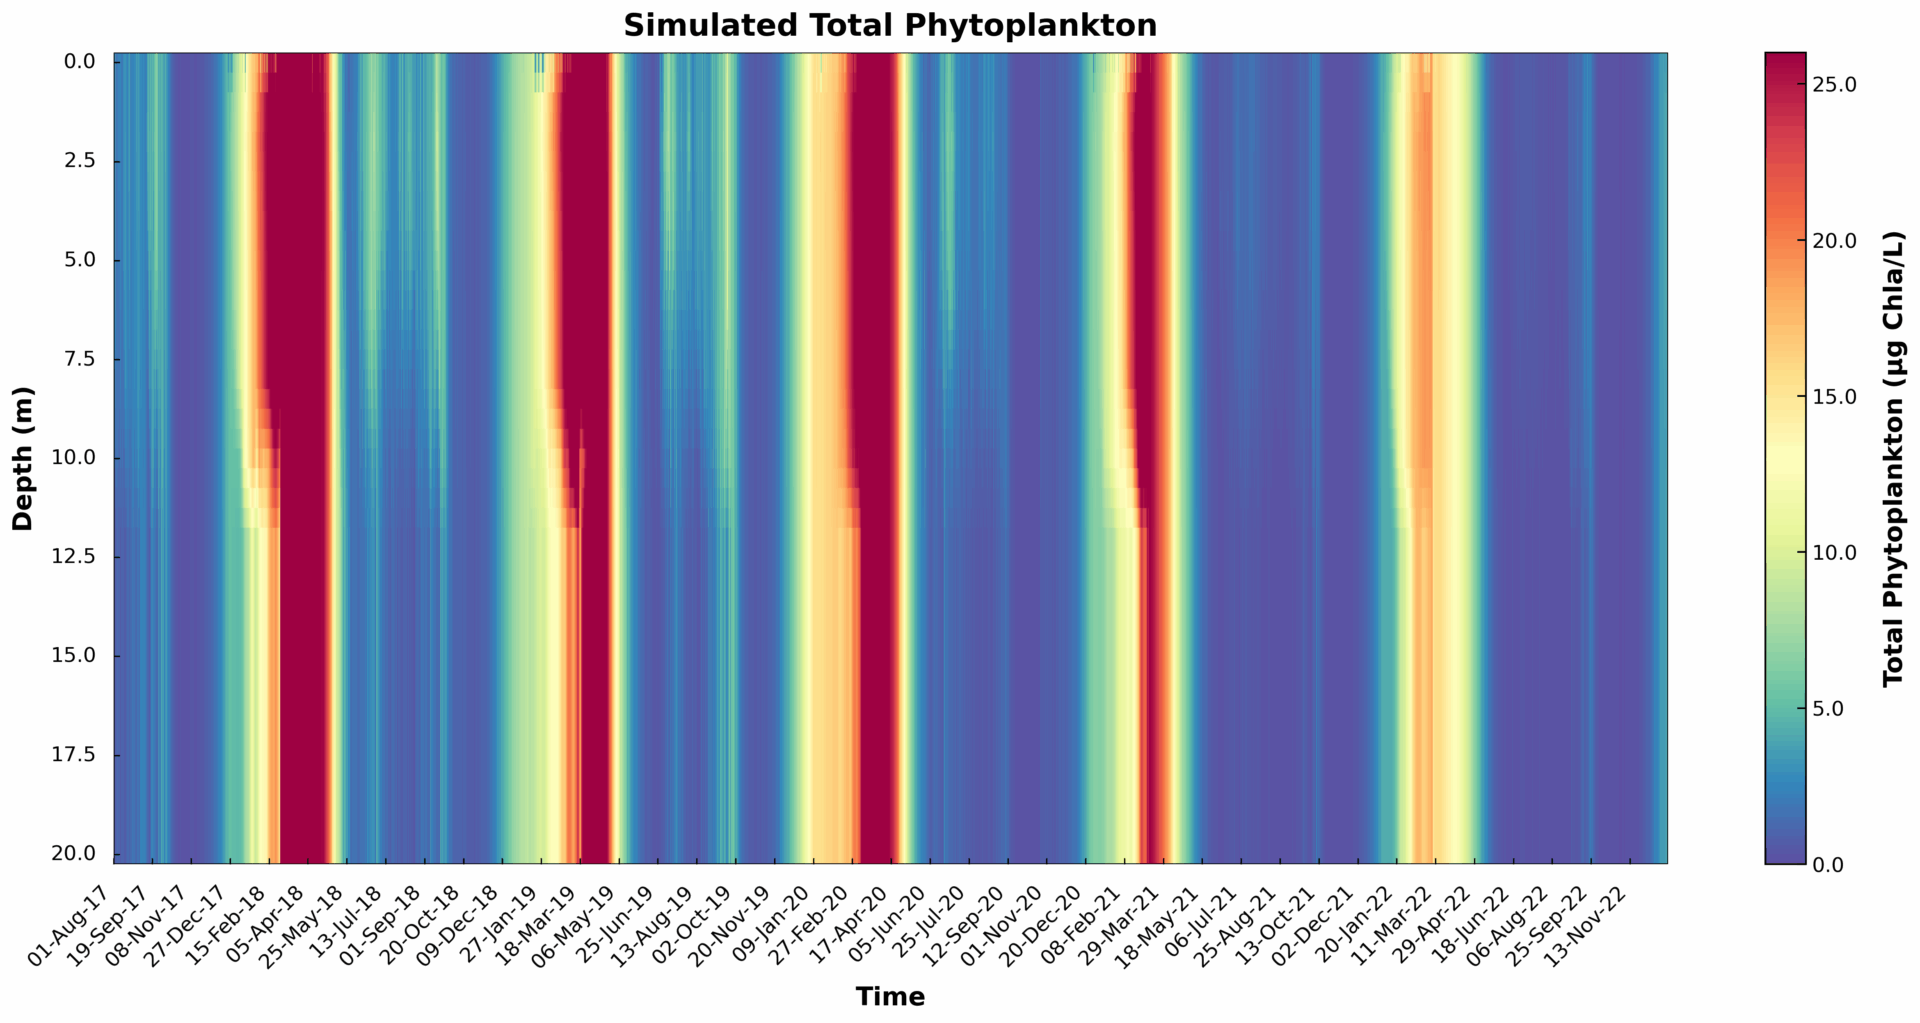
The model effectively reproduced key biogeochemical patterns observed in the water column, particularly the vertical stratification of dissolved oxygen and seasonal phytoplankton dynamics. Observations showed hypoxia developing in deeper layers during summer months, which is successfully captured by the model. The simulation also replicated surface-intensified phytoplankton blooms during warmer periods. This resulted in oxygen depletion at depth due to increased biological demand.
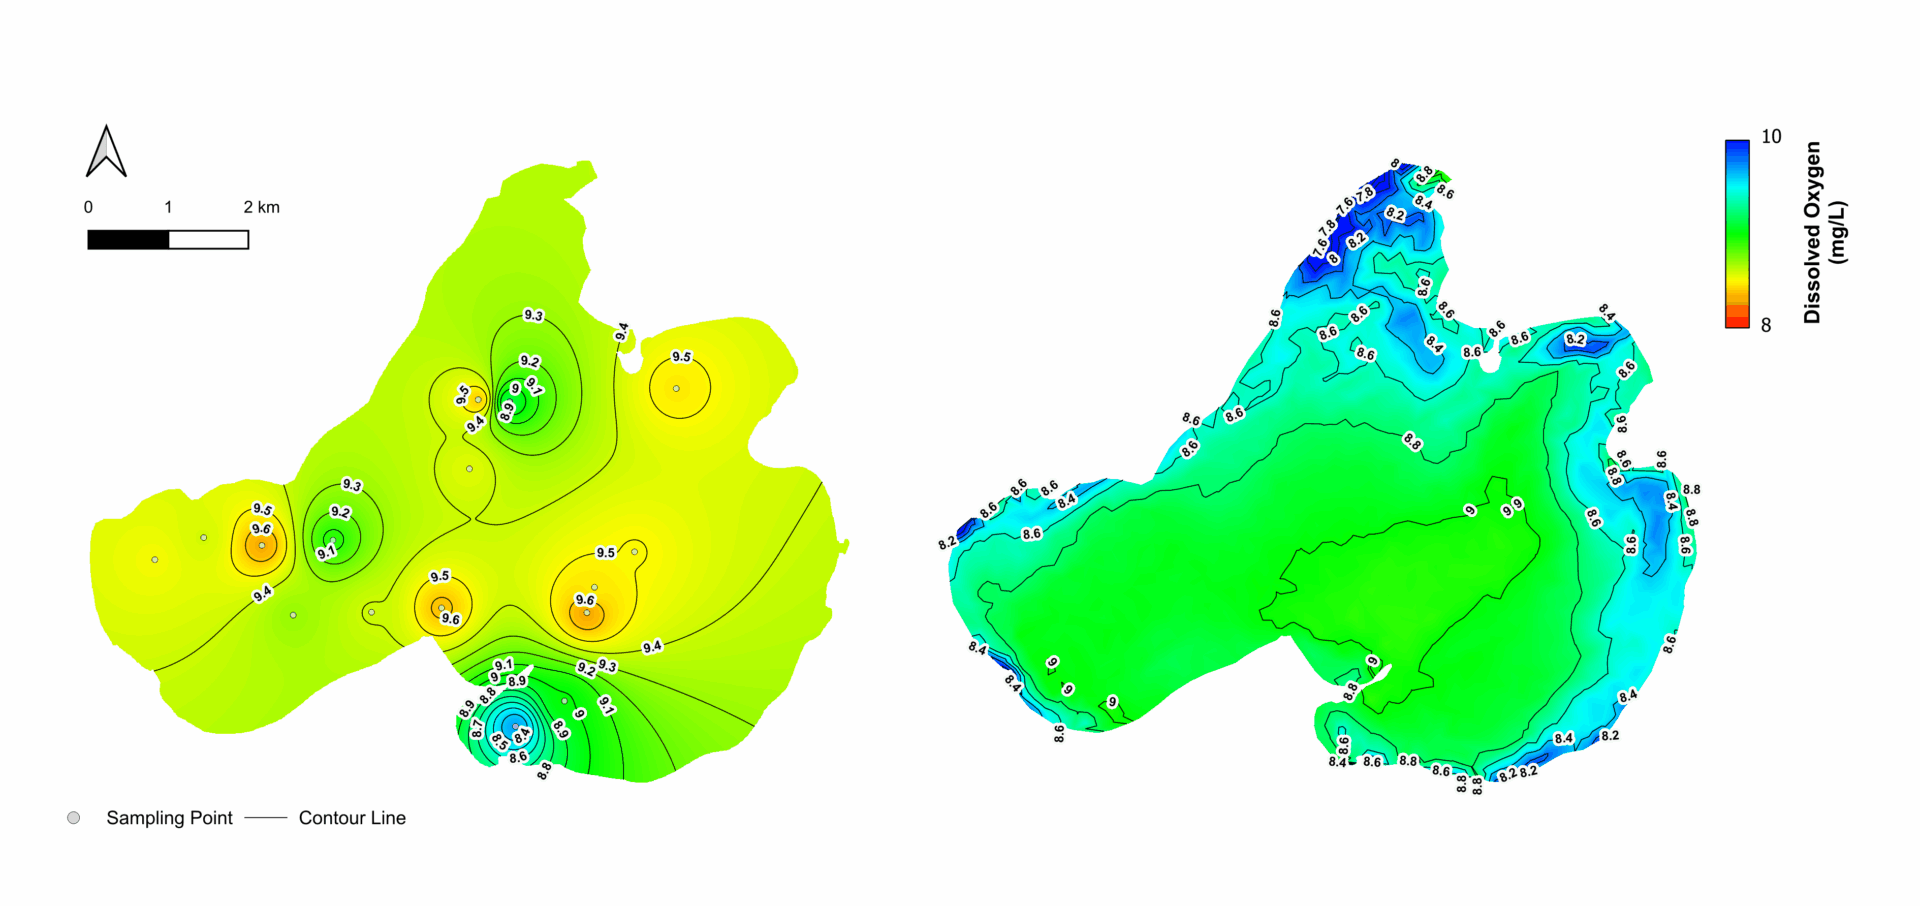
A comparison of observed and simulated data from August 2017 to December 2022 is shown in Figure 3, and the plan view of DO at the water surface is shown in Figure 4. This highlights the model’s capability to resolve temporal and spatial variability, despite some data scarcity and interpolation artifacts in the observational dataset.
Figure 3. Observed (top) and simulated (bottom) structures and temporal evolution of Dissolved Oxygen (left) and Total Phytoplankton (right) at the buoy, from August 2017 to December 2022.
Missing hourly observations were interpolated, which may introduce artifacts.
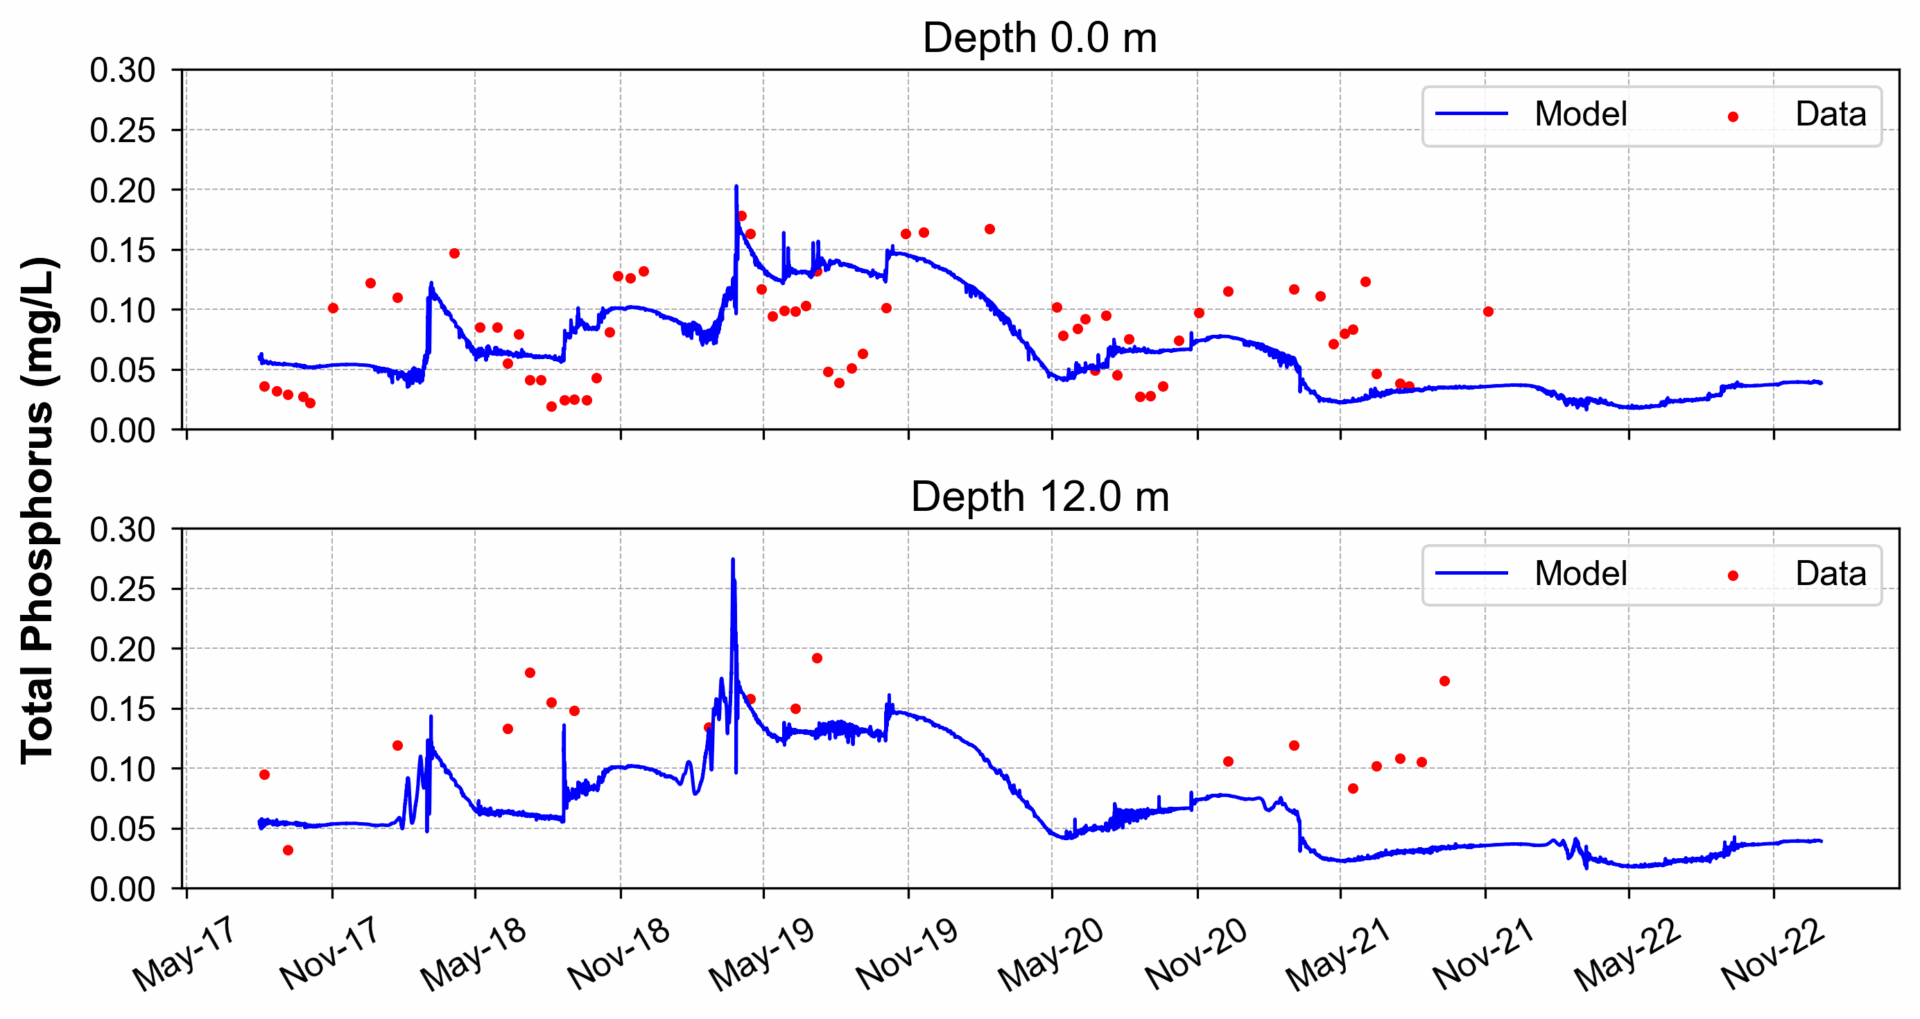
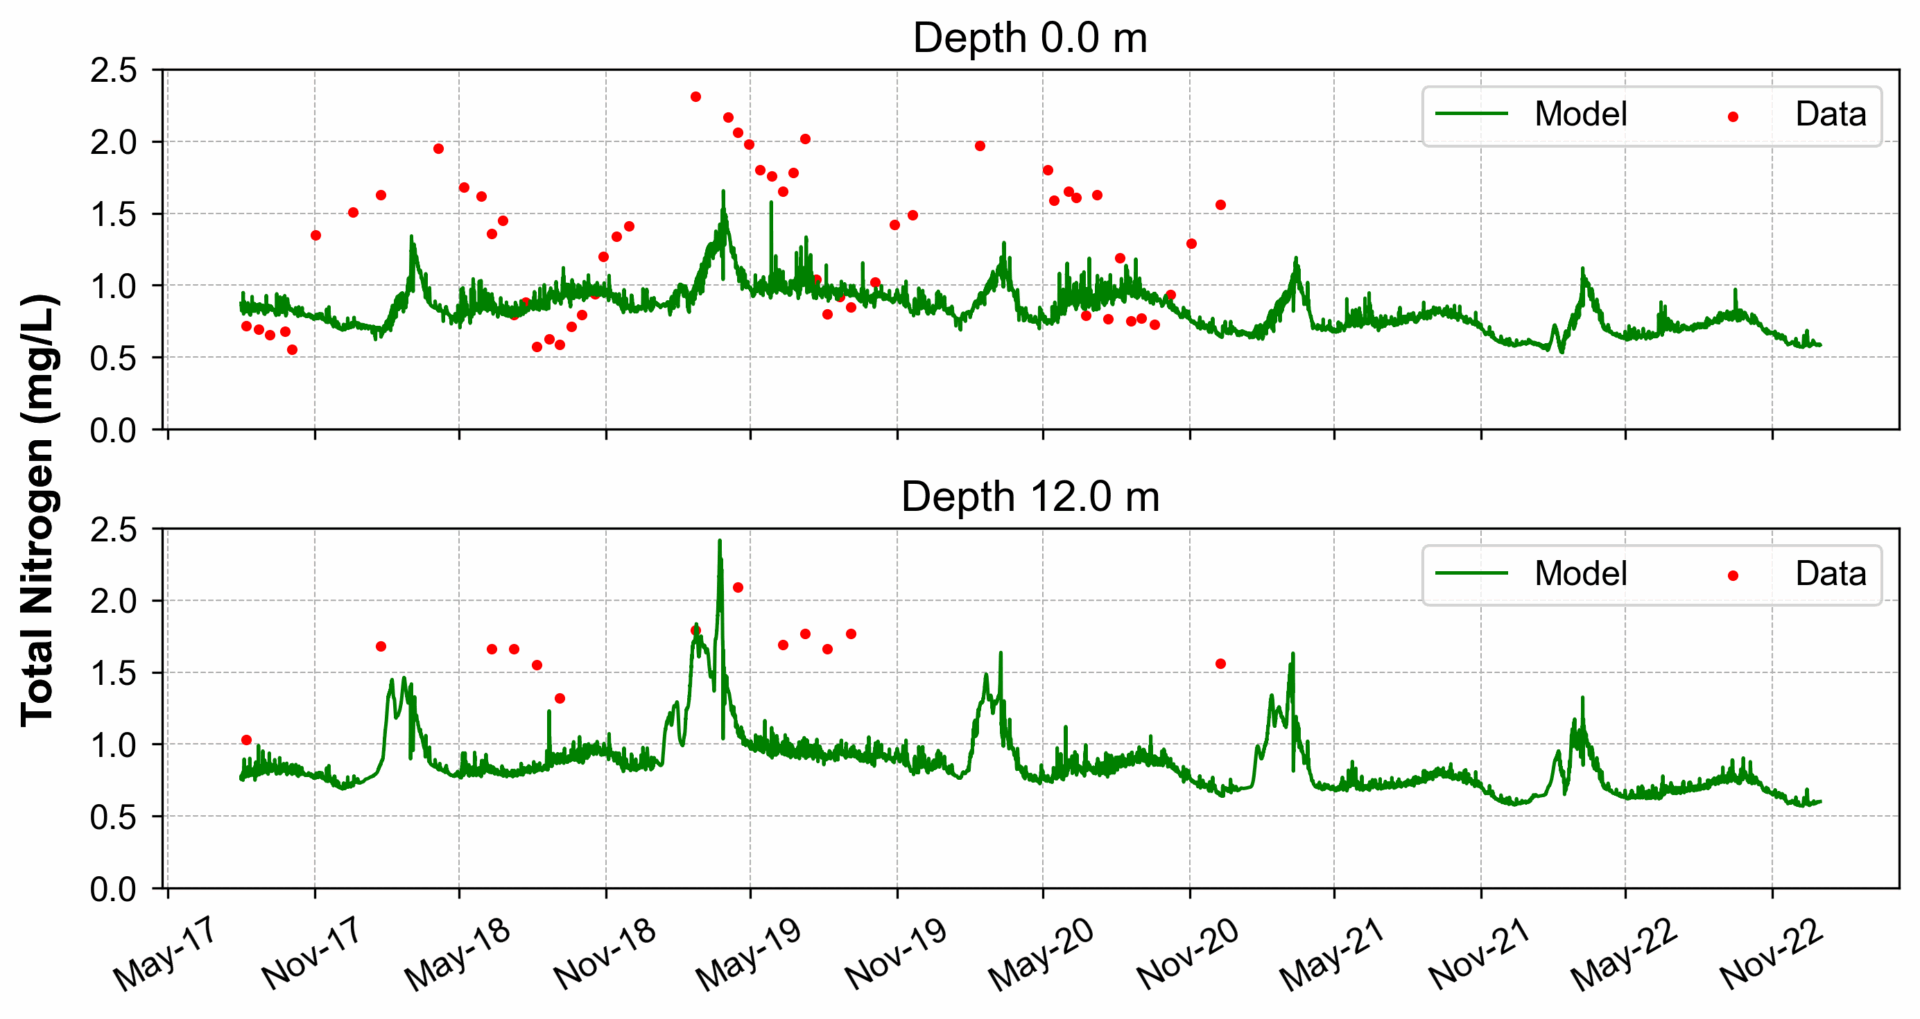
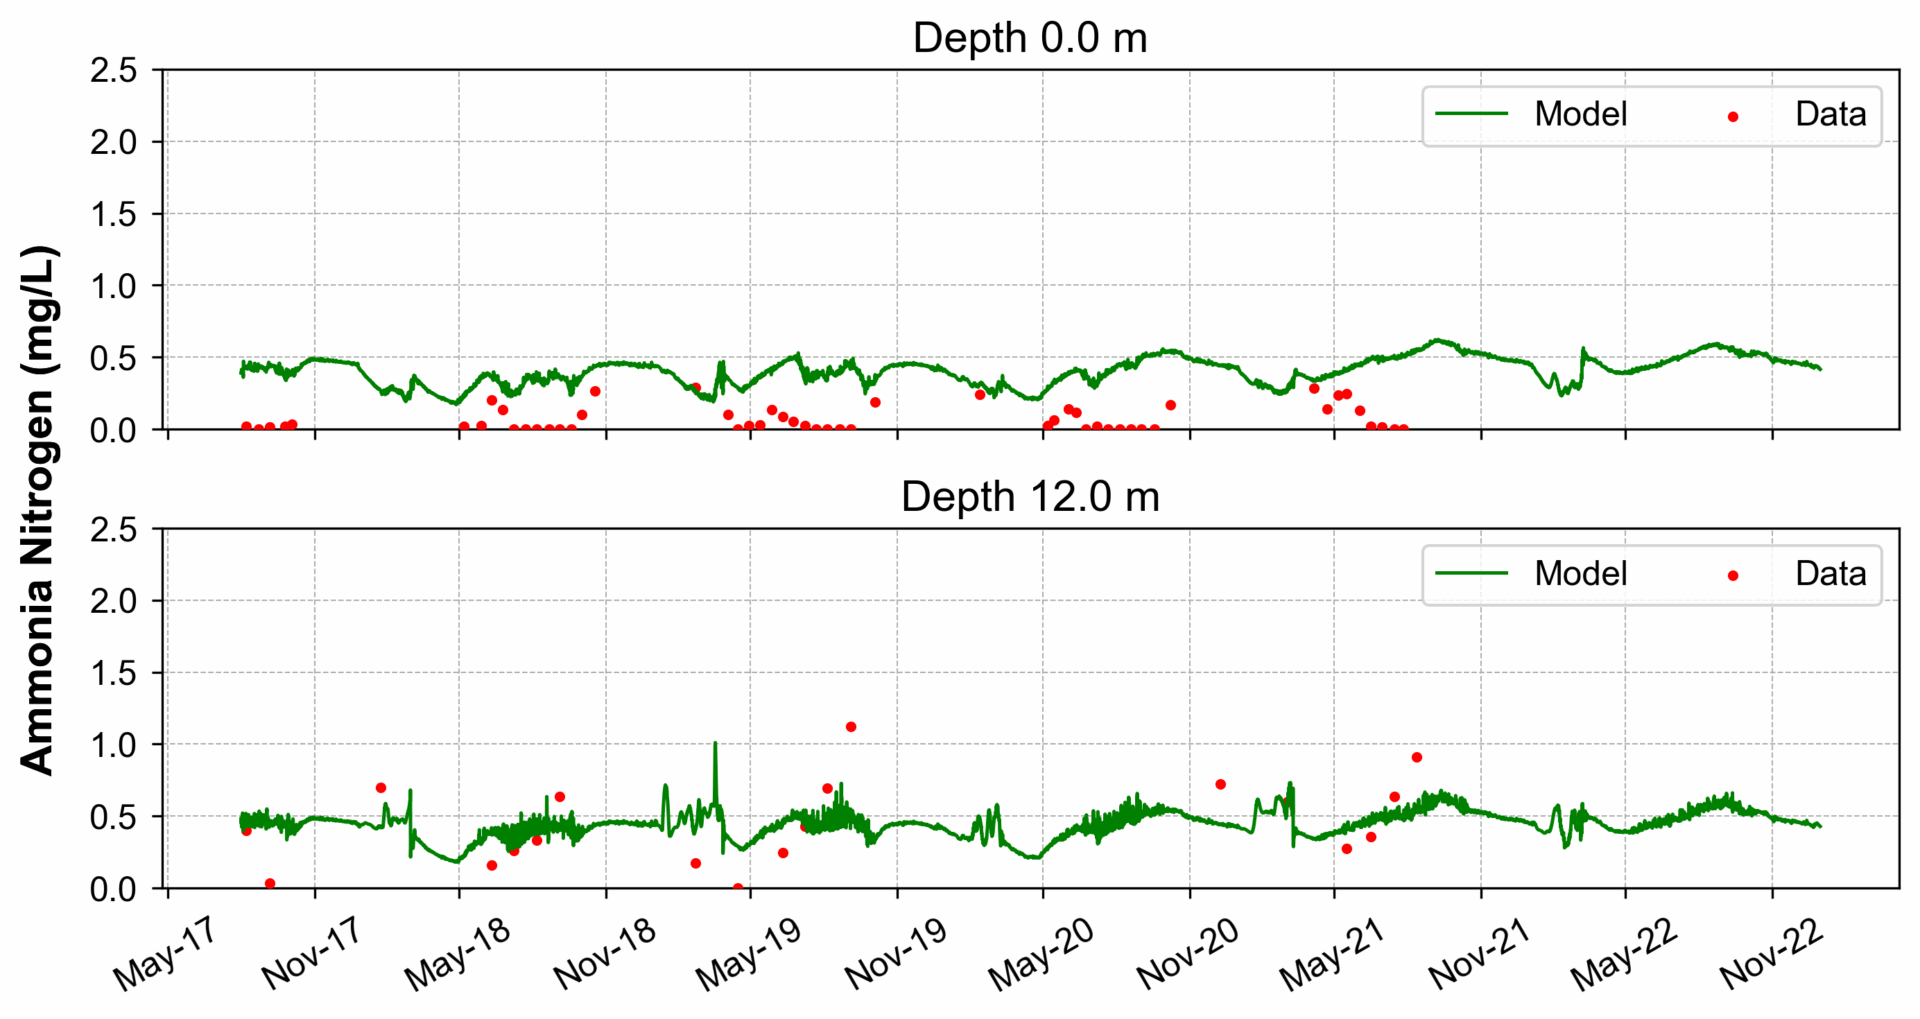
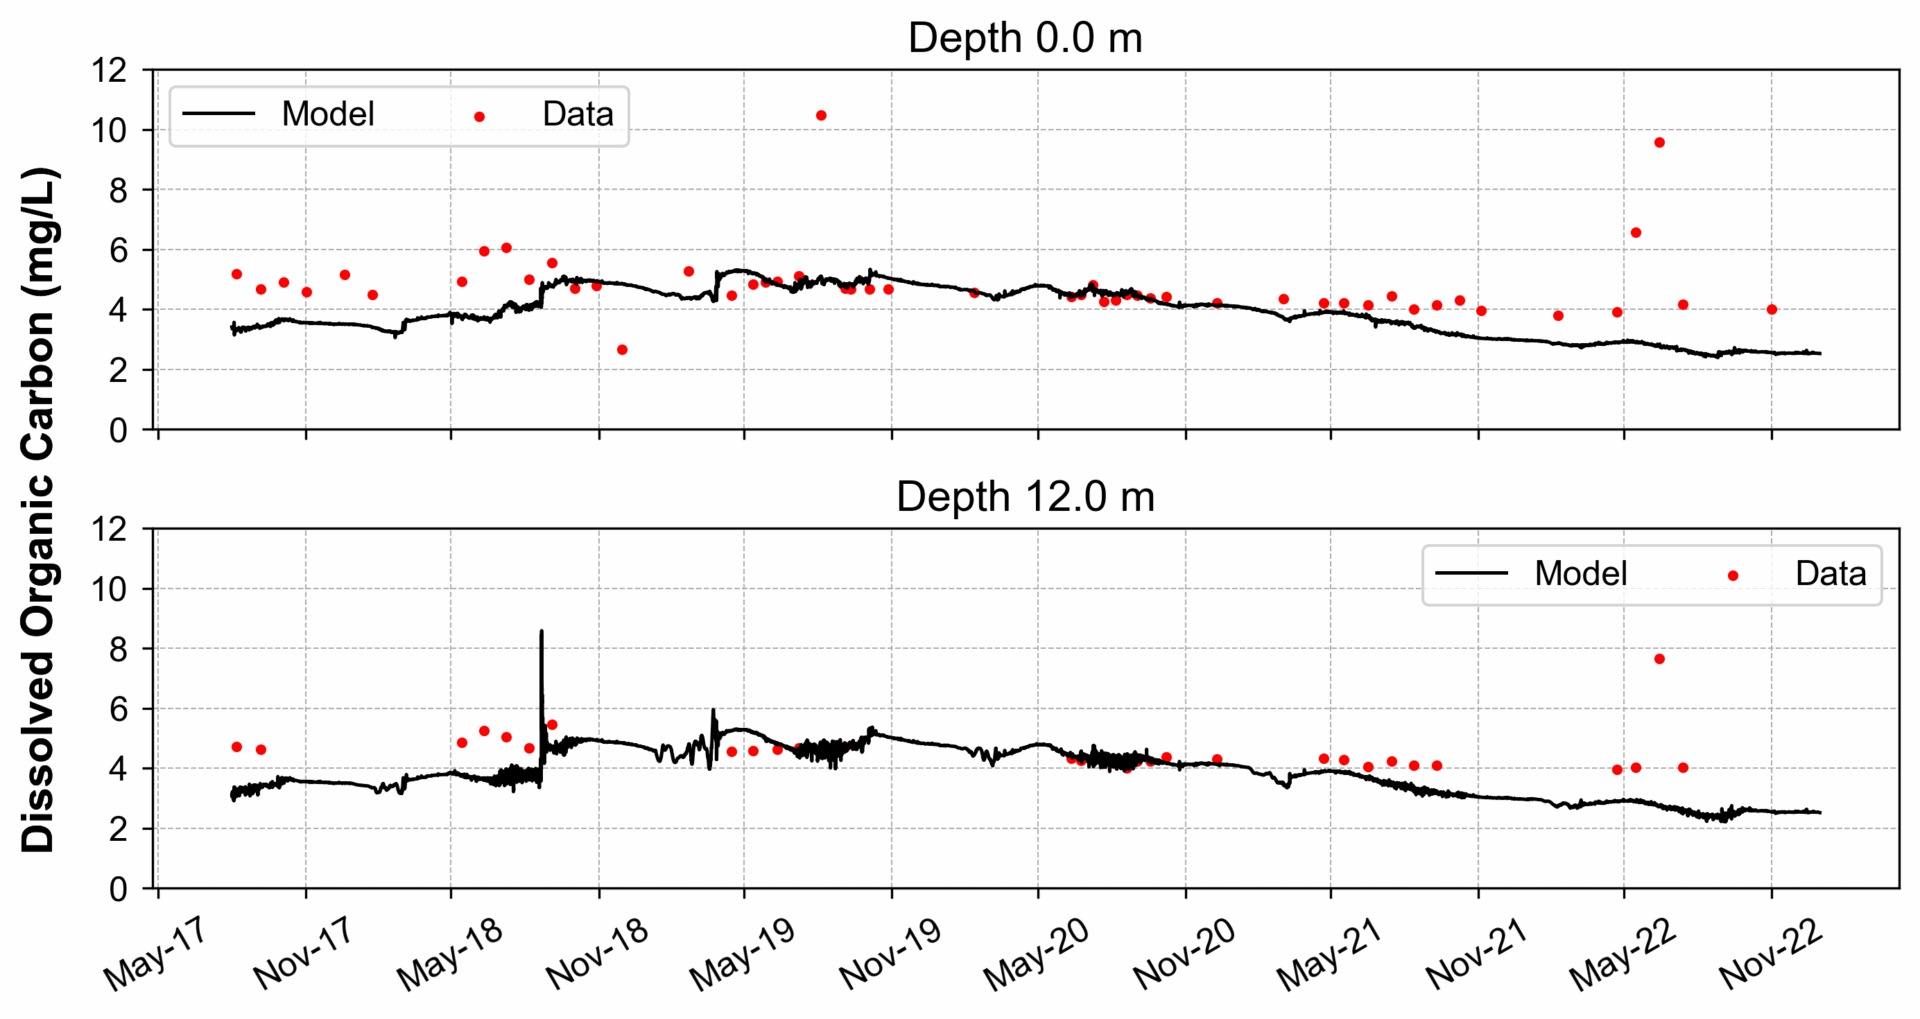
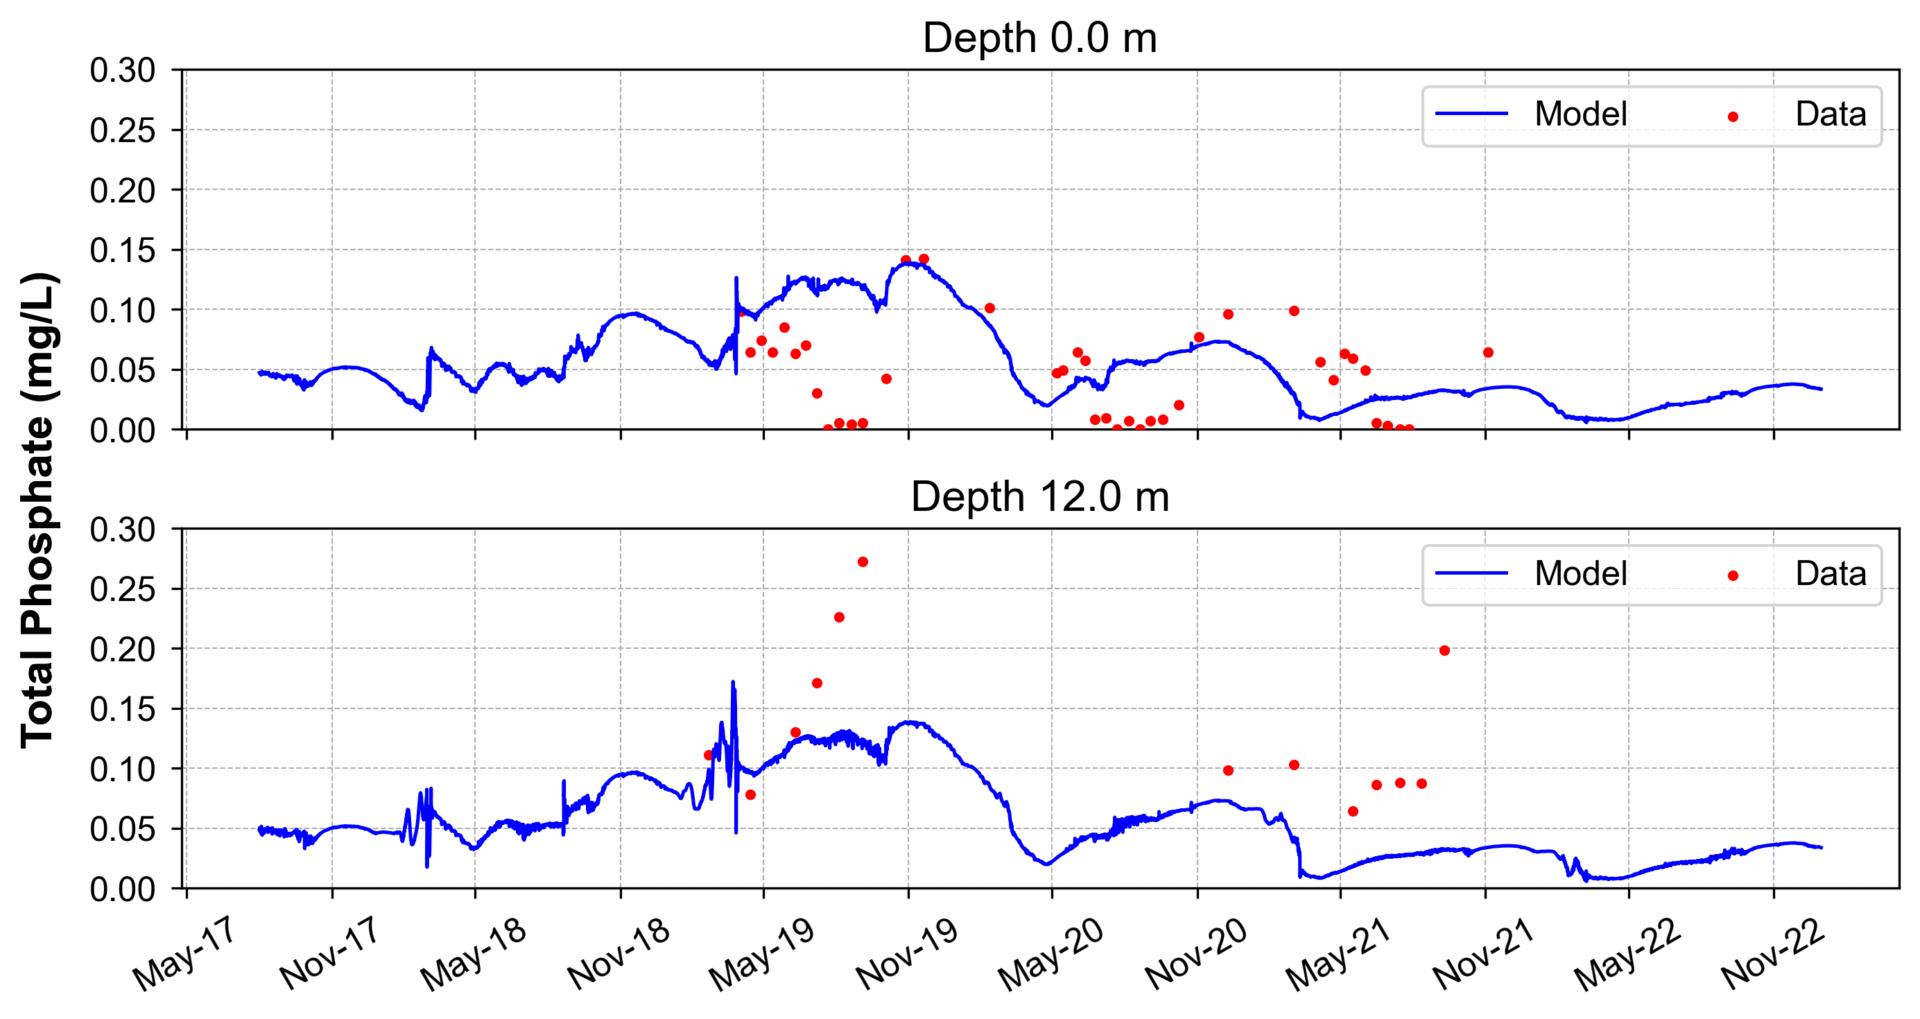
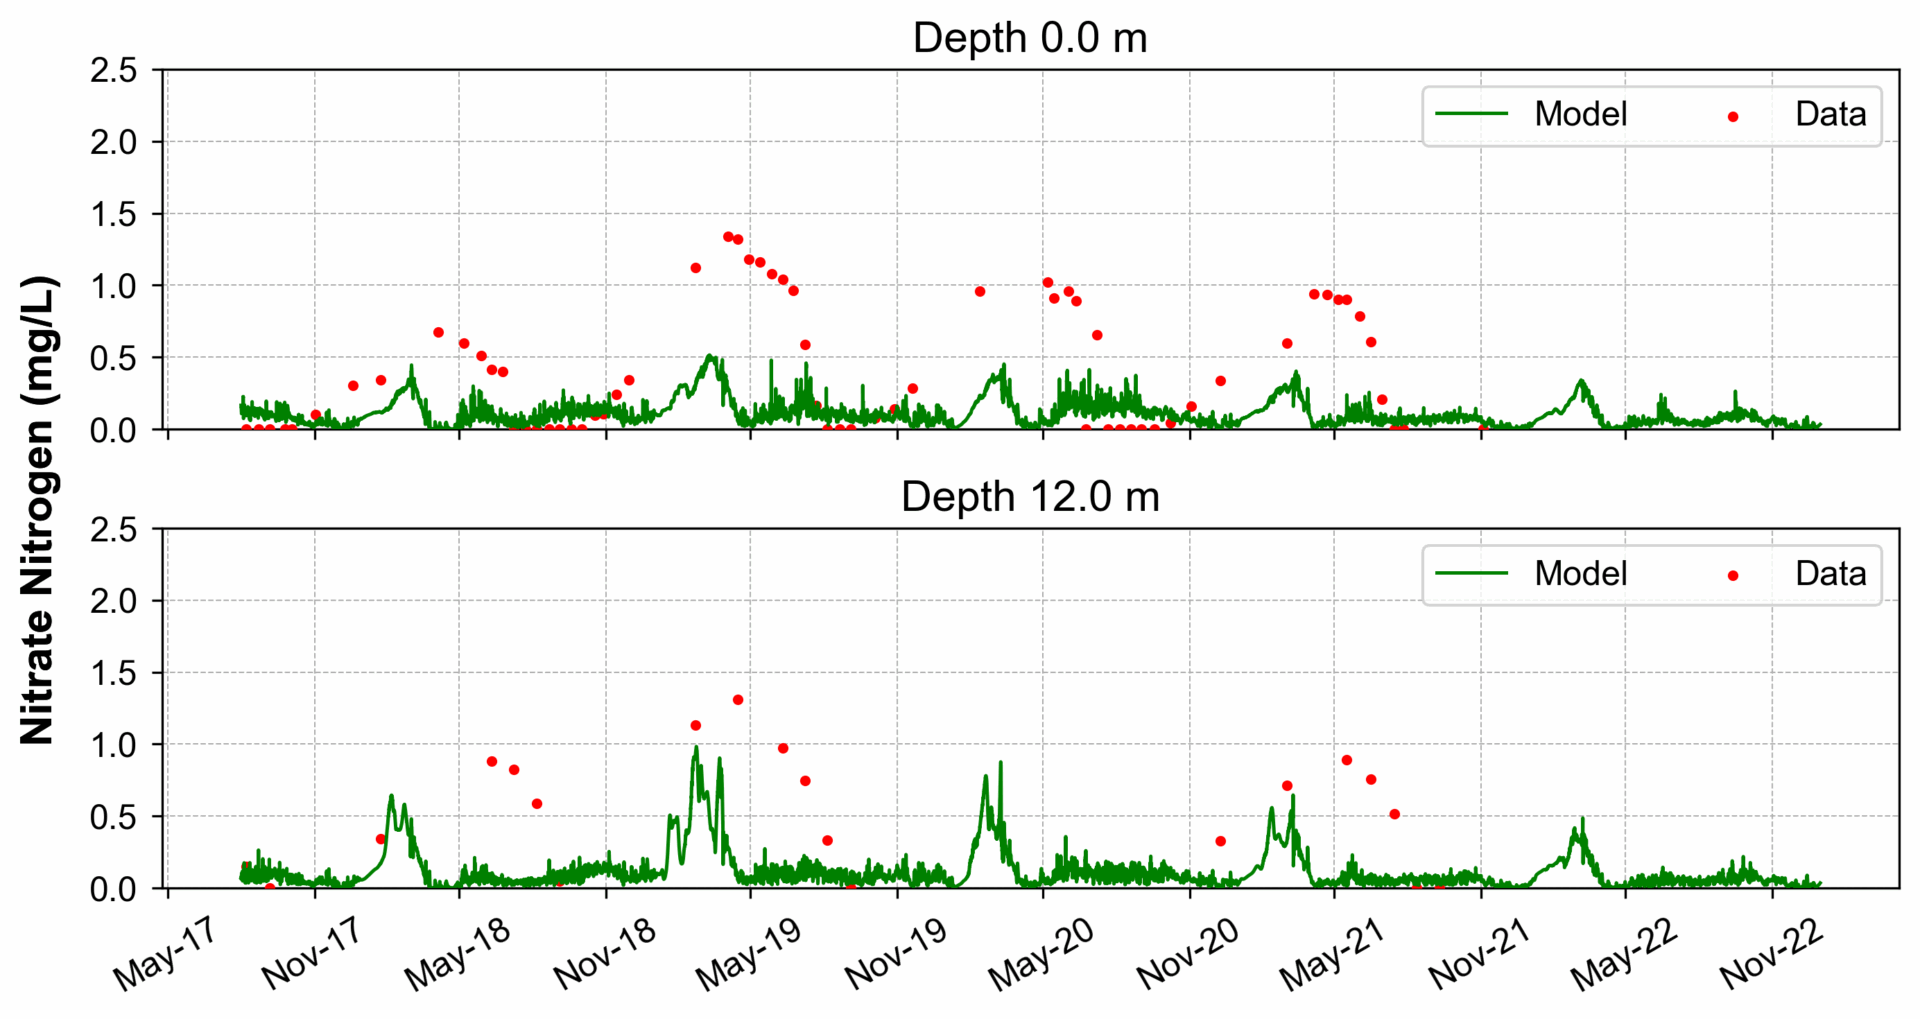
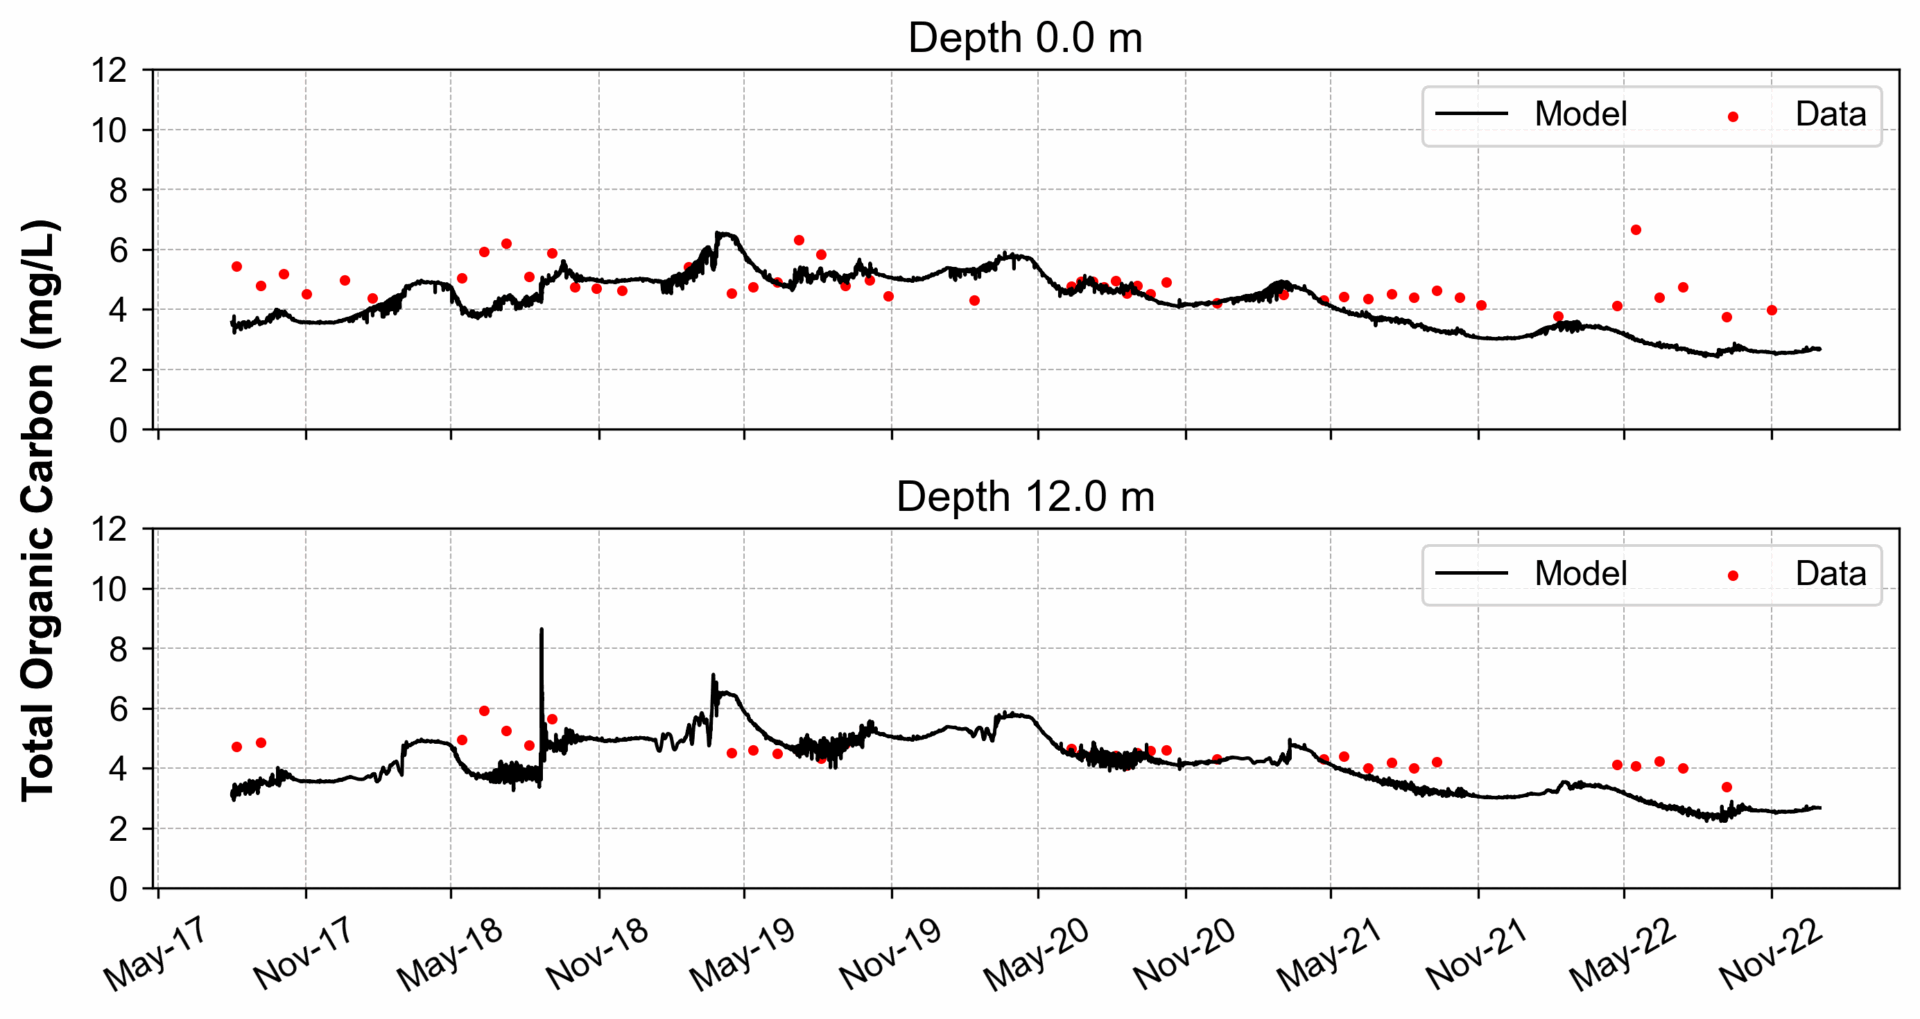
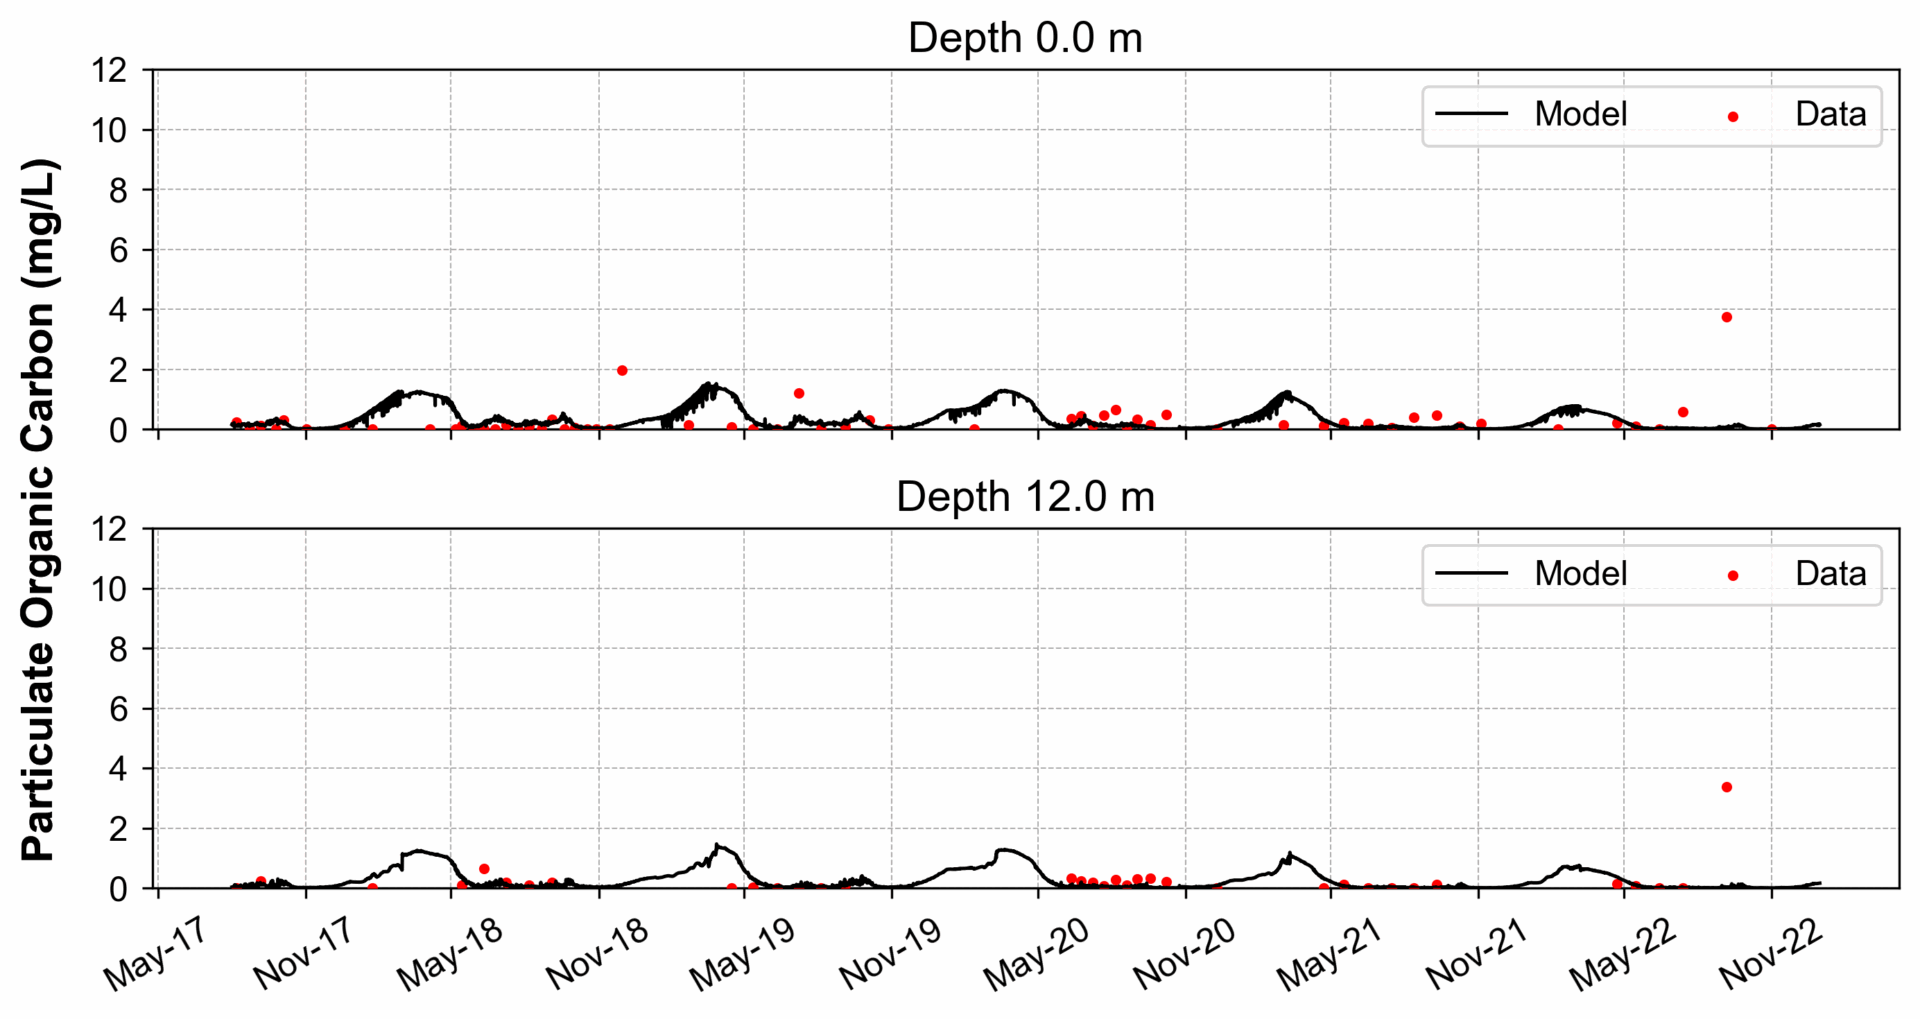
The model calibration for nutrients strongly aligns with observed seasonal trends, particularly during algal blooms when nutrient concentrations peaked (Figure 5). The nitrogen and phosphorus levels at 20 meters were underpredicted, likely due to the absence of sediment diagenesis processes in the model. Despite this, the model performed well in simulating dissolved organic carbon (DOC), capturing vertical trends with only minor deviations at greater depths during high-activity periods. Total organic carbon (TOC) simulations were also robust, effectively reflecting both surface and deeper-layer dynamics, which indicates a well-calibrated representation of organic matter cycling and decay.
Figure 5. Time-series comparison of measured (red dots) and simulated (blue, green, black lines) nutrient concentrations from August 2017 to December 2022.
Nutrient groups are displayed in order with color-coded lines: phosphorus, nitrogen, and carbon.
The three-dimensional EFDC+ model developed for Lake Mendota provides valuable insights into the complex interactions between physical, chemical, and biological processes in a eutrophic lake system. By accurately simulating dissolved oxygen dynamics, phytoplankton distributions, and nutrient cycling, the model effectively captures both temporal and spatial variability driven by stratification and external loadings. Model results indicate strong seasonal patterns in nutrient cycling, with peak concentrations during algal blooms. Sensitivity analyses highlight the effect of temperature on growth and metabolism, along with sediment nutrient flux and kinetic rates. Overall, this work effectively uses EEMS and EDI open datasets to demonstrate the potential of integrated modeling approaches to support lake management and water quality forecasting.
[simpay id=”6281″]
[simpay id=”6276″]
Your support ticket has been successfully submitted. We will get back to you as soon as we can.