A lock is a hydraulic structure employed to facilitate the movement of boats, ships, and similar watercraft between different water levels on rivers and canals. In addition to moving volumes of water with each lockage, it also transports the constituents in the water, potentially causing undesired water quality impacts. Historically, hydrodynamic models of rivers and canals ignored or approximated these exchanges. With the release of EEMS 12, a user can now directly account for water and constituent transport through any number of locks.
Navigation locks are some of the most complicated hydraulic structures engineers are challenged with designing. Below is a description of the lock mechanism used for boats navigating both upstream and downstream.
For a boat going upstream:
- The lower gates open and the boat enters the lock.
- After it enters the lock, the lower gates are closed, and the lock is filled with water from upstream.
- Then the upper gates are opened, and the boat exits the lock.
For a boat going downstream:
- The upper gates open and the boat enters the lock.
- After it enters the lock, the upper gates are closed, and the lock is emptied by draining its water downstream.
- Then the lower gates are opened, and the boat exits the lock.
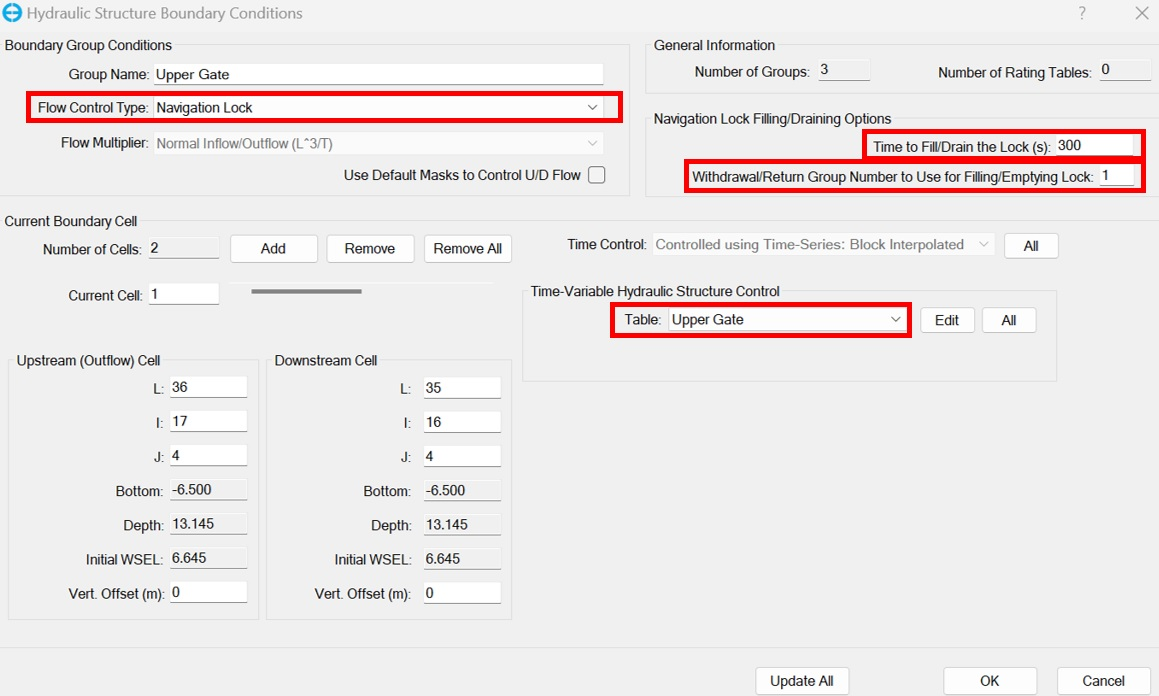
EFDC+ is a powerful tool to simulate navigation locks hydraulic structures. EFDC+ links the lock hydraulic structure to the withdrawal/return flow boundary to specify maximum flow rates and which cells to remove and return flows for the lock filling/emptying (Figure 1). When the user selects the Time Control option on the hydraulic structure form, the user then can specify a time series of lock opening/closing operations. To finish the lock specification, the user specifies a nominal time to fill/empty the lock and selects which withdrawal/return boundary group configured for this lock gate. It is important to note that the estimated time required to fill or drain the locks is a rough estimate and may vary in practice.
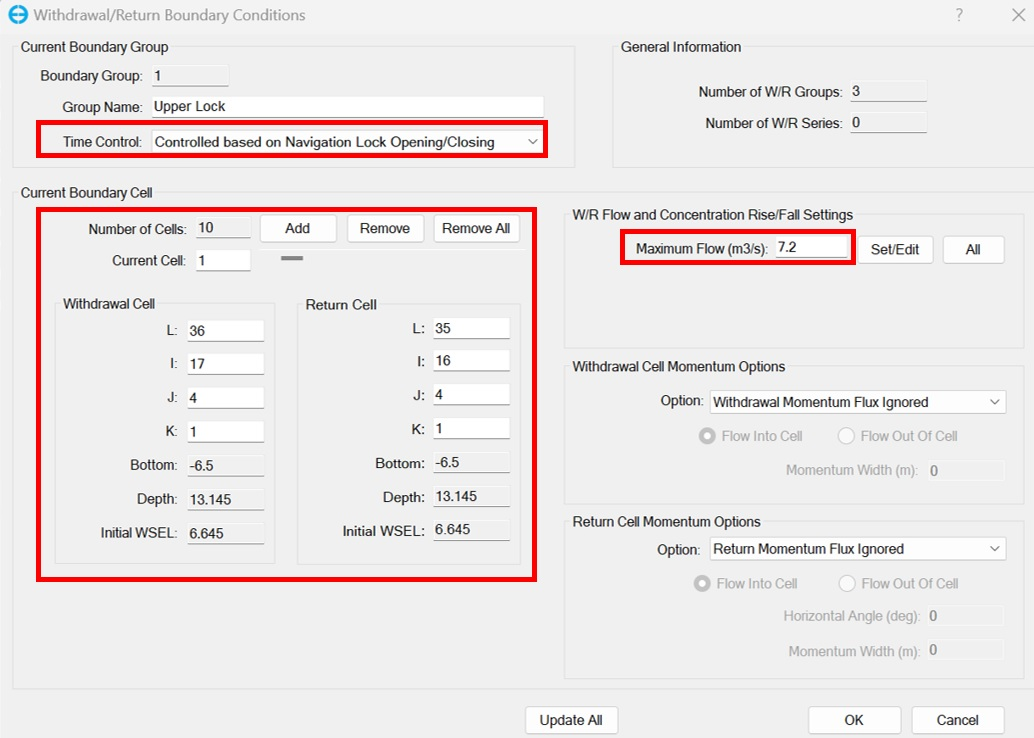
To configure the withdrawal/return boundary condition for the lock, the user builds the list of cells to withdraw and return the flows (Figure 2). Next, the user selects the “Navigation Lock” for Flow Control and specifies the maximum flow rate. The maximum flow rate specified here works in conjunction with the hydraulic structure’s nominal time to control the actual time of filling/emptying.


Lock Flow Test Case
To demonstrate the functionality of the locking feature, a straightforward test model is constructed. This model represents a channel comprising three locks, with their operational steps depicted in Figure 3. One end of the model represents the sea, while the other end represents the lake, with their water level data incorporated.
The locking process involves a sequential series of operations. Firstly, when the lower gate opens, the water level in the corresponding chamber decreases to match the sea level. Once the gate closes, the middle gate opens, causing the water level in the lower chamber to rise until it reaches equilibrium with the middle chamber. This process is repeated for the middle and upper locks and chambers, ensuring that the water levels in all three chambers eventually become equal.

The animation provides a visual representation of salinity changes in the model when the locks are operational. Additionally, the graphics include water level time series of the sea and lake open boundaries to provide a comprehensive view.
For clarity, Figure 4 illustrates the time series of the gates opening during the depicted period.


