Challenges with Thermal Compliance
Water temperature has significant and systematic effects on biological processes at all levels of organization, from phytoplankton to whole ecosystems. Temperature influences several other parameters and can alter the physical and chemical properties of water such as dissolved oxygen and photosynthesis production. Some organisms, particularly aquatic plants, flourish in warmer temperatures, while some fishes such as trout or salmon prefer colder streams.
Solutions Provided by EEMS
EFDC+ provides a multitude of sub-models for temperature simulation. This includes a robust heat model allowing accurate temperature transport simulation, fully accounting for surface heat exchange and solar radiation impact. A bed thermal model and heat coupled ice sub-module are available. When working on colder regions, where ice formation and ice melt impact the hydrodynamics, surface processes such as oxygen reaeration, or contaminant fate and transport, EFDC+ provides the ability to represent the ice with a robust ice sub-model linked to the heat sub-model.
When dealing with thermal power plant cooling water, EEMS provides the means to simulate the impacts of once through cooling with a range of forced evaporation options.
Examples of Studies Done with EEMS
Hydrothermal Study, Lay Dam, Coosa River, AL, USA
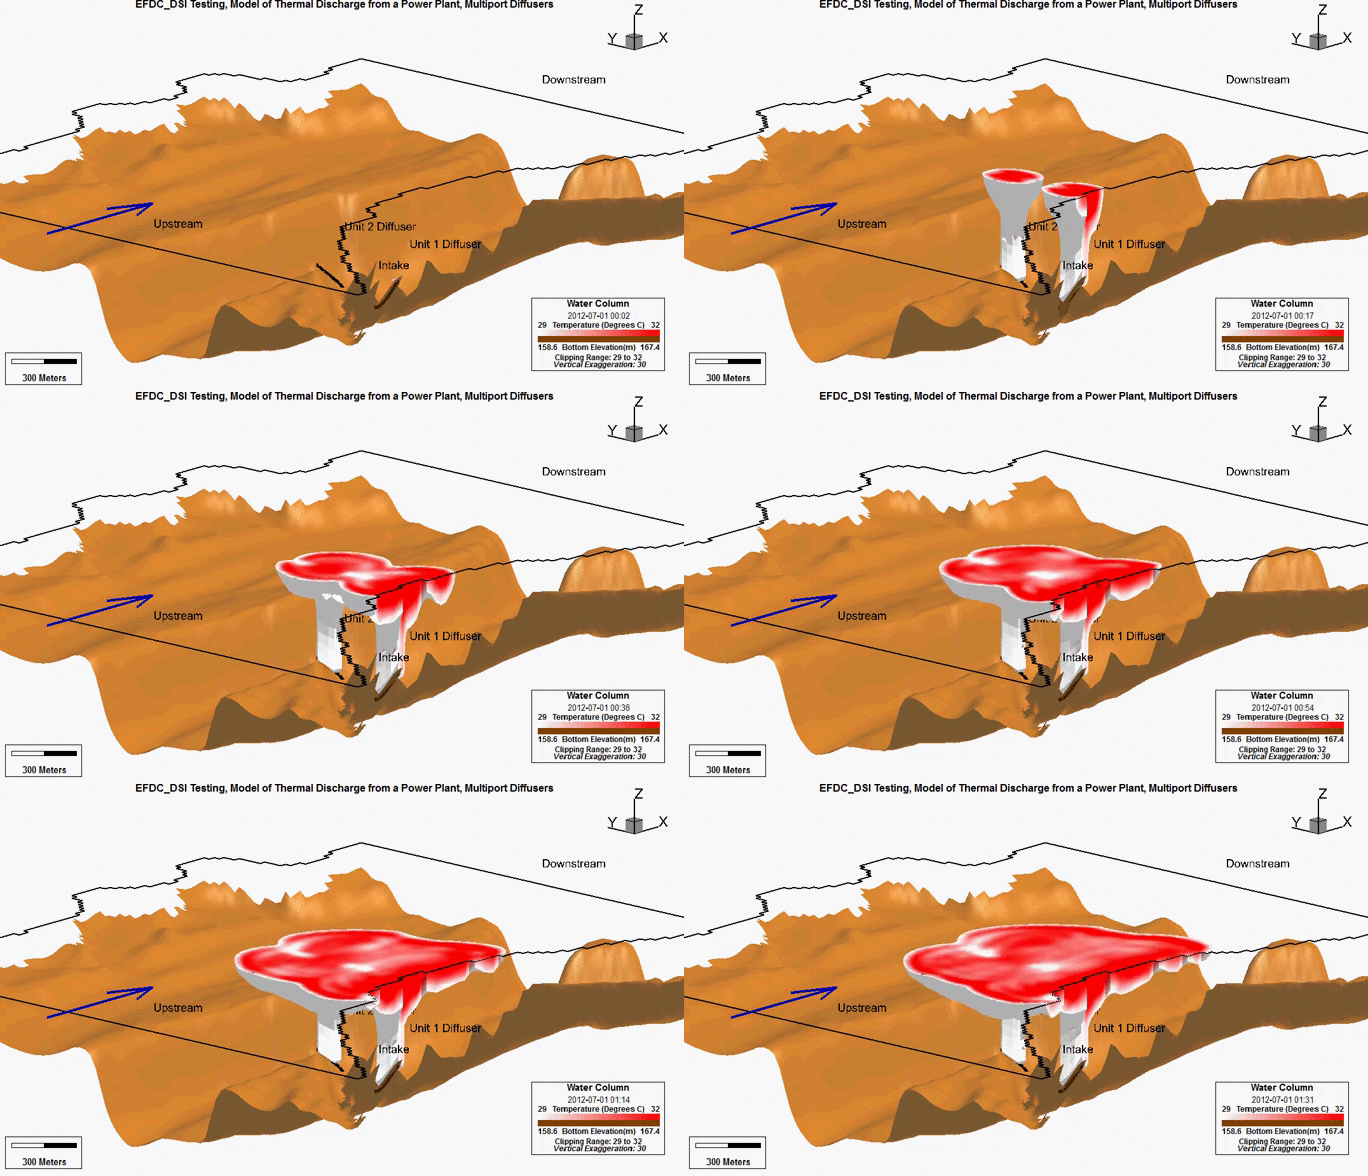
Electricity production accounts for one of the largest water usages in the United States and worldwide. Water for thermoelectric power is used in generating electricity with steam-driven turbine generators. Surface water was the source for more than 99 percent of total thermoelectric-power withdrawals according to USGS surveys. Forced evaporation (FE) in a receiving water body due to added heat from once-through cooling for thermal electric generating plants has been studied by Electric Power Research Institute (EPRI) and the USGS. However, these approaches are for screening level analyses and/or analytical solution. In contrast, EEMS is equipped with the tools to address site specific FE such as the following study carried out on the Coosa River, Alabama.
Real-time Thermal Hydrodynamic Model Decision Support Tool, AL, USA
DSI developed a real-time 3D hydrothermal model for Coosa River, AL, between Logan Martin Dam and Lay Dam using EEMS. The model’s external forcing factors include flow releases from Logan Martin and Lay Dam, flows from tributaries, power plant withdrawal and temperature rise, and atmospheric conditions. The real-time model was calibrated against the field measurements of flows, water level, and water temperature. The model was developed to serve as a decision-making tool for Alabama Power Company (APC) electricity generation and assist in efficient operation of Logan Martin, Lay and Plant Gaston in order to meet generation needs while staying in thermal compliance at the monitoring buoy below Gaston.
Impact of Groundwater Spring Flow Reductions on the Chassahowitzka River/Estuary System
Determination of the areas in the Chassahowitzka system that meet manatee habitat criteria during critical conditions from a 3D hydrodynamic (salinity and temperature) model using EEMS.
Lake Washington Real-time Modeling System System
Lake Washington is the second largest natural lake in the State of Washington, USA. It is a lake with steeply sloping sides and also has long-term, high quality vertical temperature records. This makes it an ideal case to test the Sigma-Zed layering approach. DSI has developed a hydrodynamic model of this water body with 1,183 cells and 55 layers to assess the accuracy for prediction of the epilimnion and hypolimnion. You can see the real-time output for this model here.
Download Example EE Models
Download an example model and run with the free EEMS Demo Version.
Lake Washington is second largest natural lake in the State of Washington, USA. DSI developed an hydrodynamic model of this water body to determine with what degree of accuracy the prediction of the epilimnion and hypolimnion could be made using the new Sigma-Zed approach. A version of this model with reduced number of cells may be downloaded for users to see the advantages of this approach for themselves. Model output may be compared with data measured at the buoy at the lake’s centre. See here for more details.


